Wy-Adapt Sites



Educational Resources
Featured Posts
TRKE at the 2026 Native American Education Conference
The Teacher Researcher Knowledge Exchange program will be at the Native American Education Conference August 12-13, 2026.
Program-Created Resources
Aug 11 2026
Community Engagement
Data Check-In: Macros as Indicators
During our December 9th, 2025 Virtual Session we had participants engage with macroinvertebrate data collected by the Sublette County Conservation District. Many of our educators have used macroinvertebrate data in their classrooms, so we wanted to provide them an opportunity to deepen their understanding of how this data is collected by inviting guest researchers, Sam Dilworth and Adrienne Kirkwood, to share their perspectives on macroinvertebrate analysis and field-based data collection. Throu
Analyzing and Interpreting Data
Data Check-in
In the classroom
All Other Posts
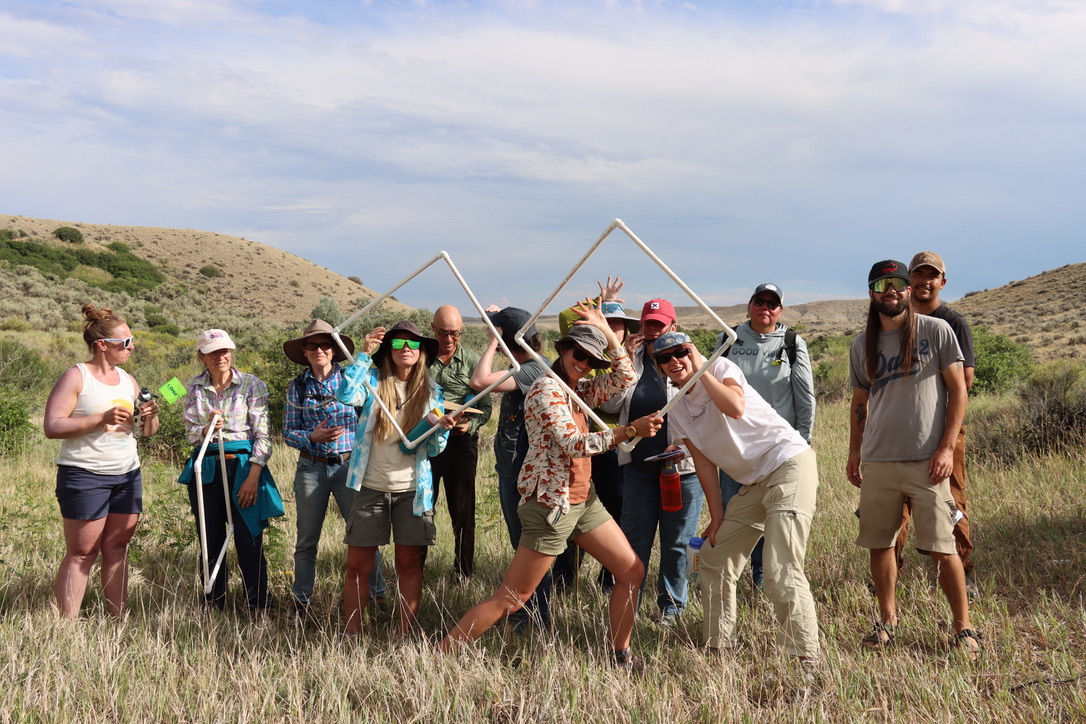 TRKE at the 2026 Native American Education Conference
Posted on Aug 11, 2026
The Teacher Researcher Knowledge Exchange program will be at the Native American Education Conference August 12-13, 2026.
Program-Created Resources
Community Engagement
 Quick Overview: Making Sense of Science Through Narrative
Posted on Mar 25, 2026
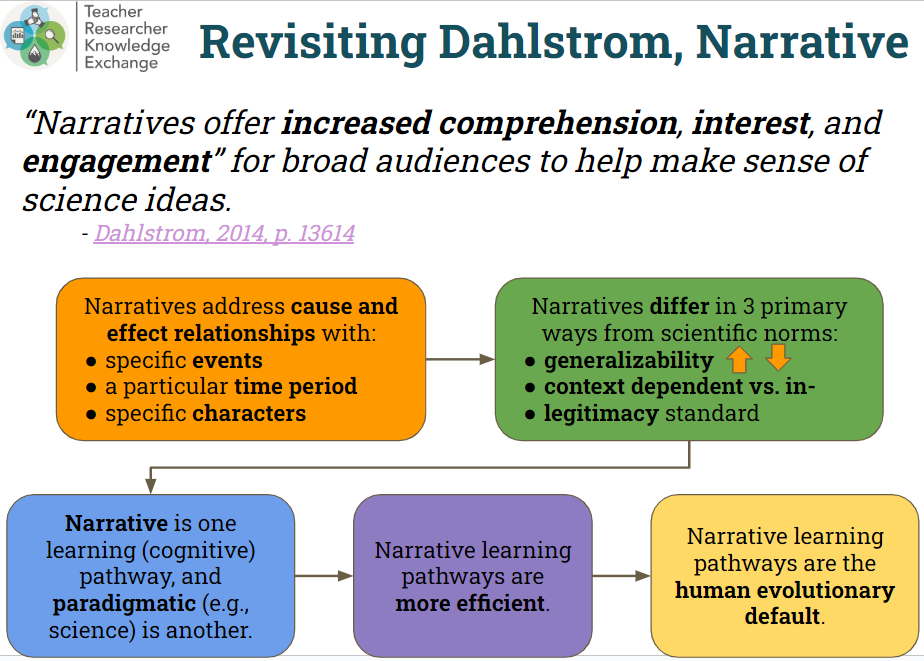
Narratives support sense-making in science by connecting abstract data and patterns to lived experience, place, and perspective, creating space for curiosity and reasoning. In this post, Dr. Mary Keller highlights how data-informed storytelling can serve as a powerful tool for learning and communication by integrating key elements from narrative research and practice.
WyAdapt Connected
Data Visualization
Analyzing and Interpreting Data
In the classroom
 Using Narrative to Support Sensemaking with Data
Posted on Mar 25, 2026
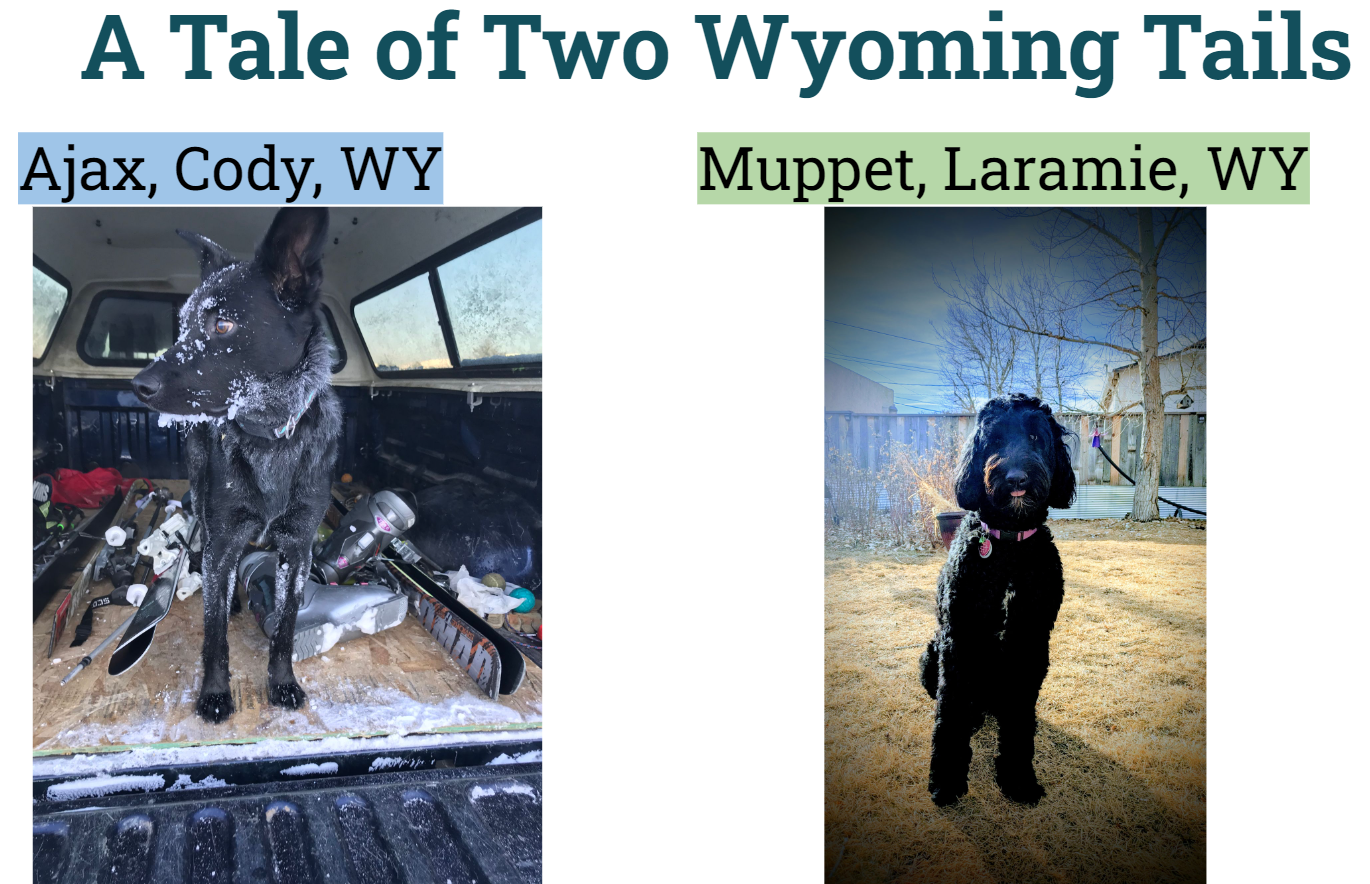
Narratives support sense-making in science by connecting complex data and patterns to lived experience, place and perspective, creating space for curiosity and reasoning. Dr. Mary Keller highlights how data-informed storytelling can serve as a powerful tool for learning and communication, illustrating this through an example progression of two dogs using the WY-Adapt Climate Comparison tool to determine where they can meet to go skijoring.
WyAdapt Connected
Data Visualization
Analyzing and Interpreting Data
In the classroom
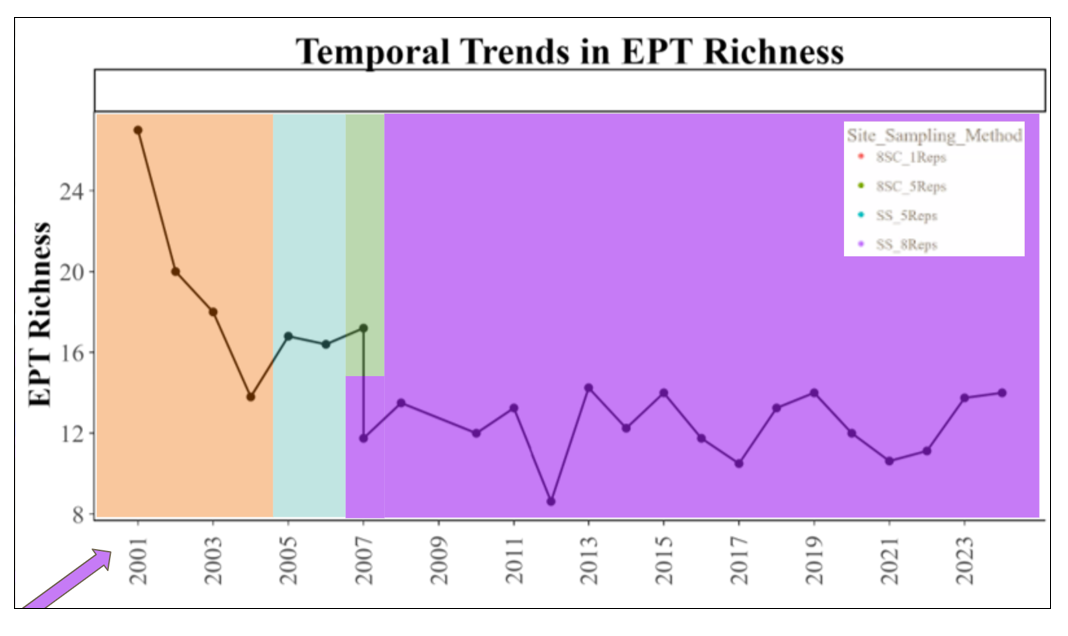 Data Check-In: Macros as Indicators
Posted on Jan 13, 2026
During our December 9th, 2025 Virtual Session we had participants engage with macroinvertebrate data collected by the Sublette County Conservation District. Many of our educators have used macroinvertebrate data in their classrooms, so we wanted to provide them an opportunity to deepen their understanding of how this data is collected by inviting guest researchers, Sam Dilworth and Adrienne Kirkwood, to share their perspectives on macroinvertebrate analysis and field-based data collection. Throu
Analyzing and Interpreting Data
Data Check-in
In the classroom
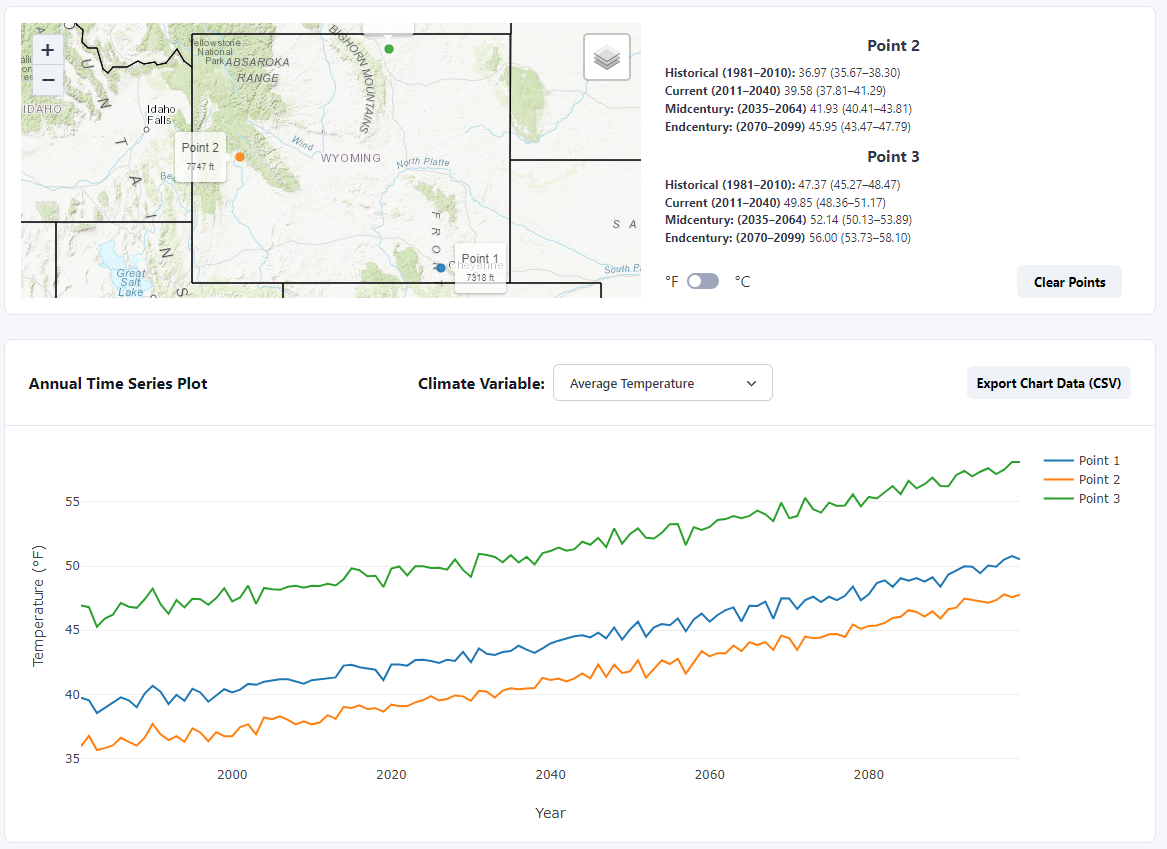 Climate Comparison Tool
Posted on Nov 13, 2025
Educators asked for a way to compare climate data from multiple locations, and the WY-Adapt team delivered. This Climate Comparison tool lets users select multiple points on a map and compare modeled climate variables--such as temperature and precipitation--across historical, current and future time periods. With this visualization tool, users can easily explore how climate conditions differ across the Western United States and parts of Canada and Mexico.
WyAdapt Connected
Data Visualization
Analyzing and Interpreting Data
In the classroom
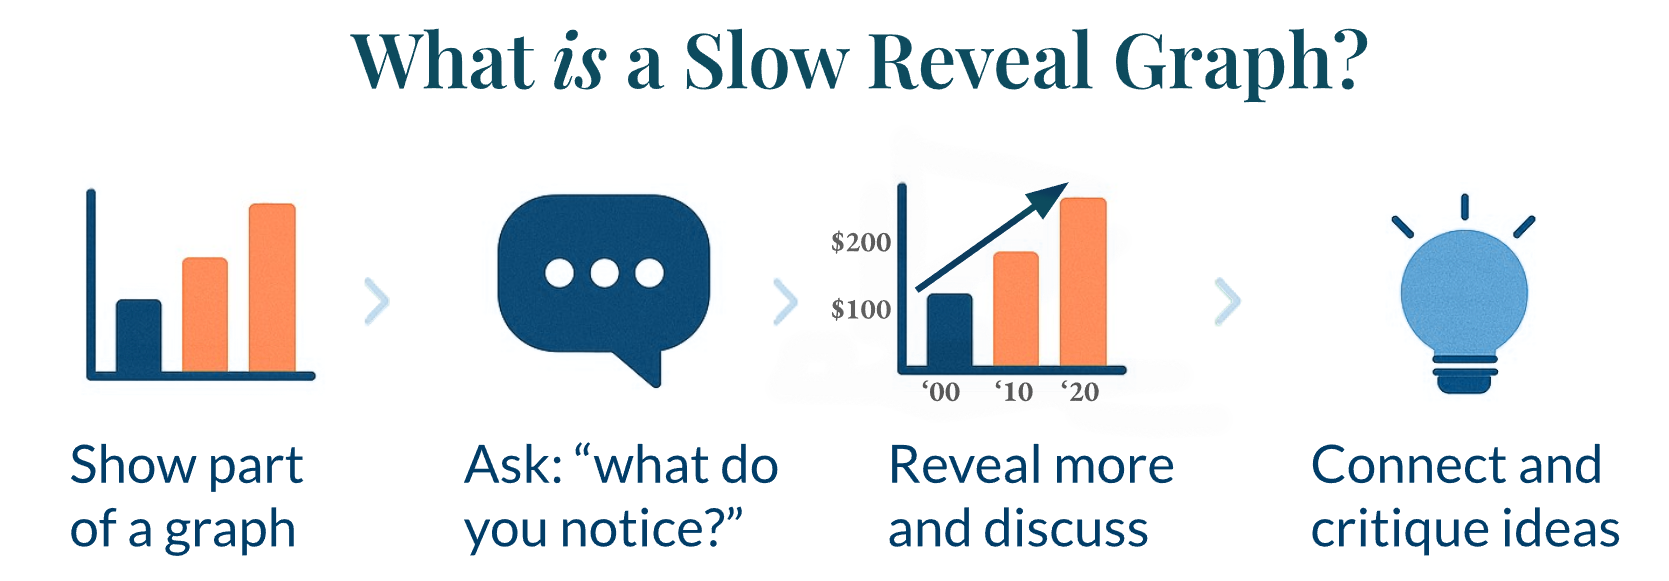 Data Check-In: The Slow Reveal Strategy
Posted on Oct 27, 2025
We designed this check-in to demonstrate how the slow reveal method can be used to help learners make sense of data visualizations. Instead of presenting a complete graph all at once, components are revealed in stages. At each stage, learners are invited to notice patterns, ask questions, and adjust their thinking and sensemaking.
Analyzing and Interpreting Data
Data Check-in
In the classroom
WyAdapt Connected
Climate Data
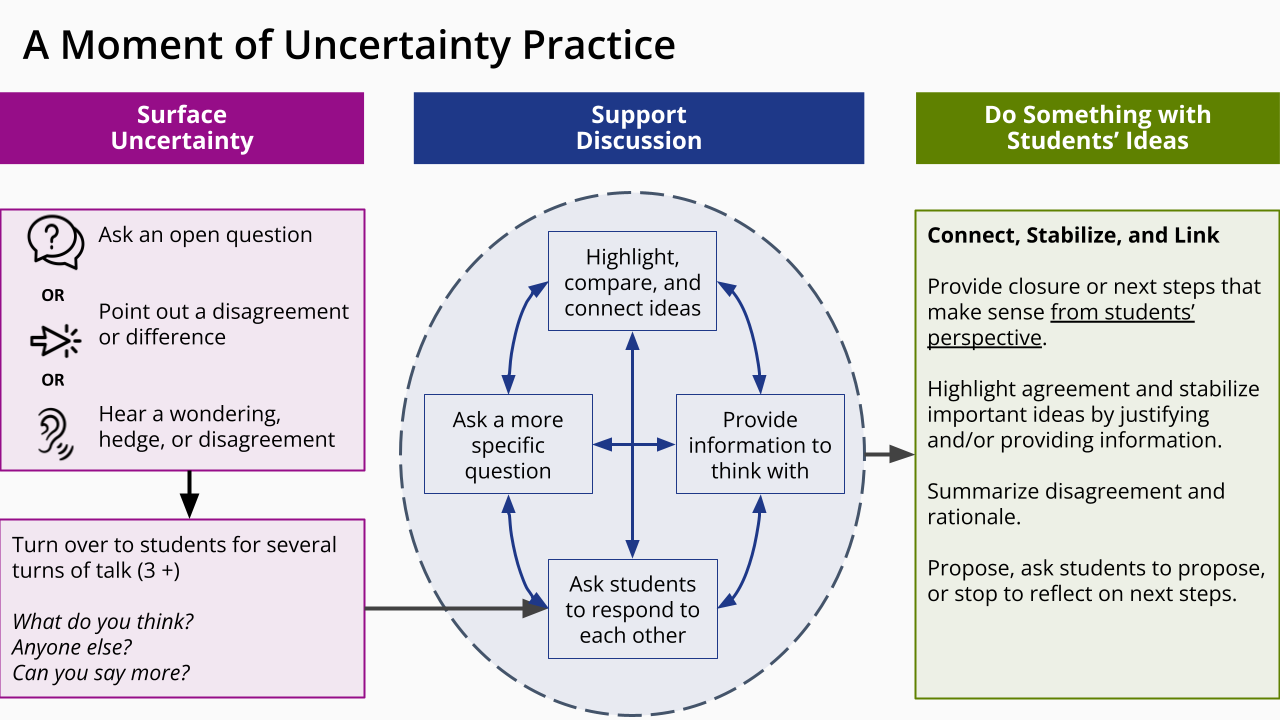 The Moment of Uncertainty Framework
Posted on Sep 29, 2025
The Moment of Uncertainty framework is a vetted and research-based approach for students to explore scientific uncertainty. It was developed through the Investigations Project and grounded in the work of science education scholar Eve Manz. It helps teachers recognize when students express doubt, make those moments visible, and use them to deepen discussion and sensemaking.
Uncertainty in Science
Analyzing and Interpreting Data
In the classroom
In the Field
 Model Bias: The Truth is Complicated
Posted on Apr 05, 2025
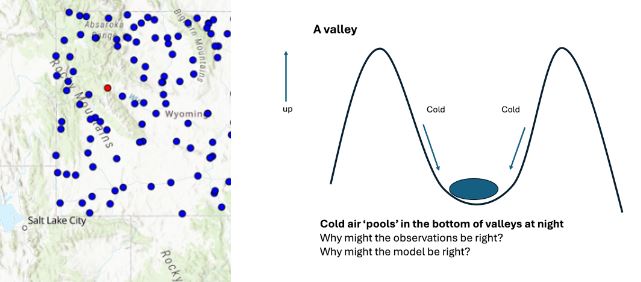
This activity enables participants to explore, analyze, and visualize climate model data alongside observed temperature data with user-friendly dashboards from WY-Adapt created by the Wyoming Anticipating the Climate-Water Transition (WyACT) team at the University of Wyoming. By comparing data from selected weather stations, participants can identify and discuss biases and uncertainties in climate models.
Uncertainty in Science
Analyzing and Interpreting Data
Climate Data
Data Visualization
WyAdapt Connected
In the classroom
 Scenario Planning and Uncertainty
Posted on Apr 05, 2025
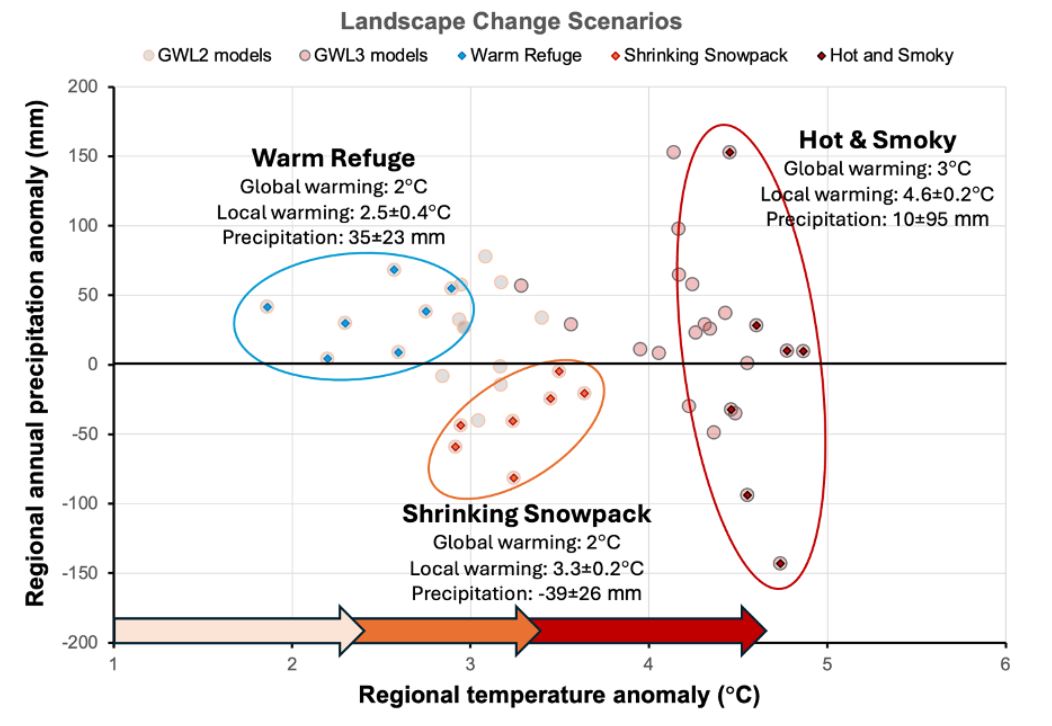
This breakout activity invites students to engage with three future scenario narratives to explore how storytelling can illuminate uncertainty in climate adaptation planning. Through discussion and reflection, learners consider how different futures can facilitate decision-making and make complex uncertainty more approachable and actionable.
Uncertainty in Science
In the classroom
Scenario Thinking and Narratives
 Data Check-In: Data Exploration Through Fact Sheets
Posted on Mar 11, 2025
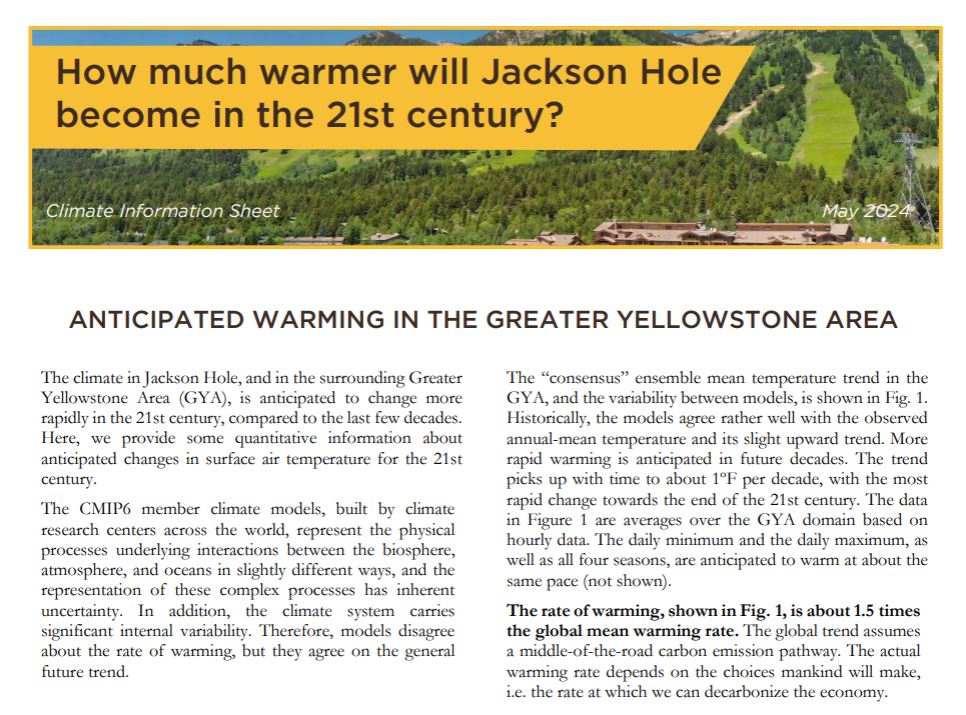
We designed this check-in to use 1-page handouts called "factsheets" that synthesize climate and water data into an accessible format. Each factsheet centers around a question people might be interested in and tries to provide a short answer to that question. They are being created by University of Wyoming researchers to disseminate research into the public's hands to facilitate meaningful engagement and real-world application.
Data Check-in
Climate Data
In the classroom
Analyzing and Interpreting Data
 Data Check-In: "Taking the Temperature of WY Public Opinion on Adapting to Climate & Water Change”
Posted on Feb 11, 2025
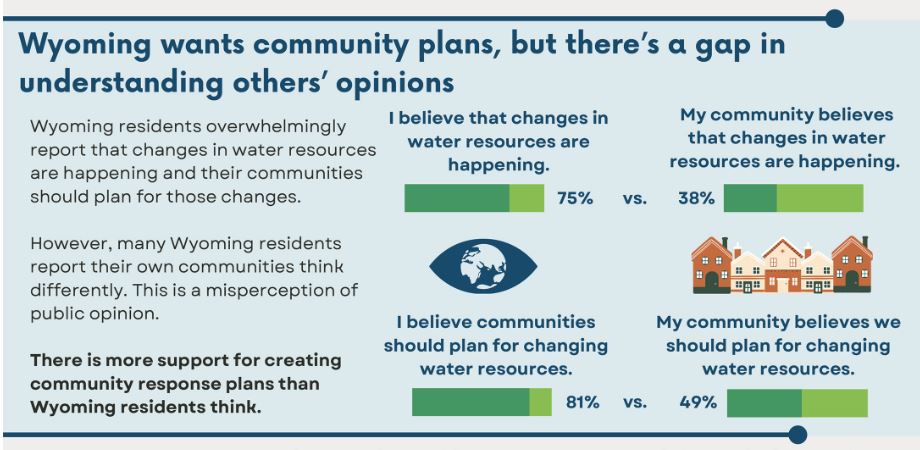
We designed this check-in to use a climate opinion survey to demonstrate how qualitative data can provide context for conversations around complex issues. Qualitative data provides students insight into people's experiences, thoughts and feelings and helps explain the "why" behind phenomena.
Data Check-in
Analyzing and Interpreting Data
In the classroom
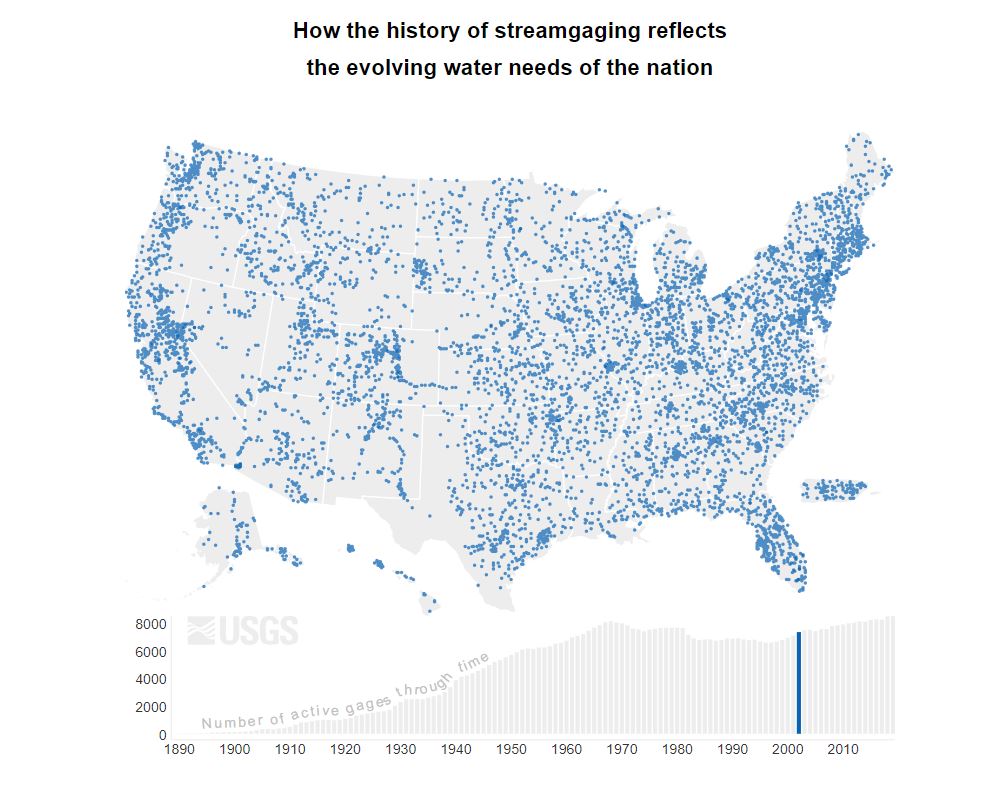 Data Check-In: Gages Through the Ages StoryMap
Posted on Dec 13, 2024
We designed this check-in to use a StoryMap. StoryMaps bring learning to life in classrooms by combining maps, multimedia, and storytelling. They help students explore subjects, build digital skills, and create interactive projects, making lessons engaging and memorable.
Data Check-in
Scenario Thinking and Narratives
In the classroom
Analyzing and Interpreting Data
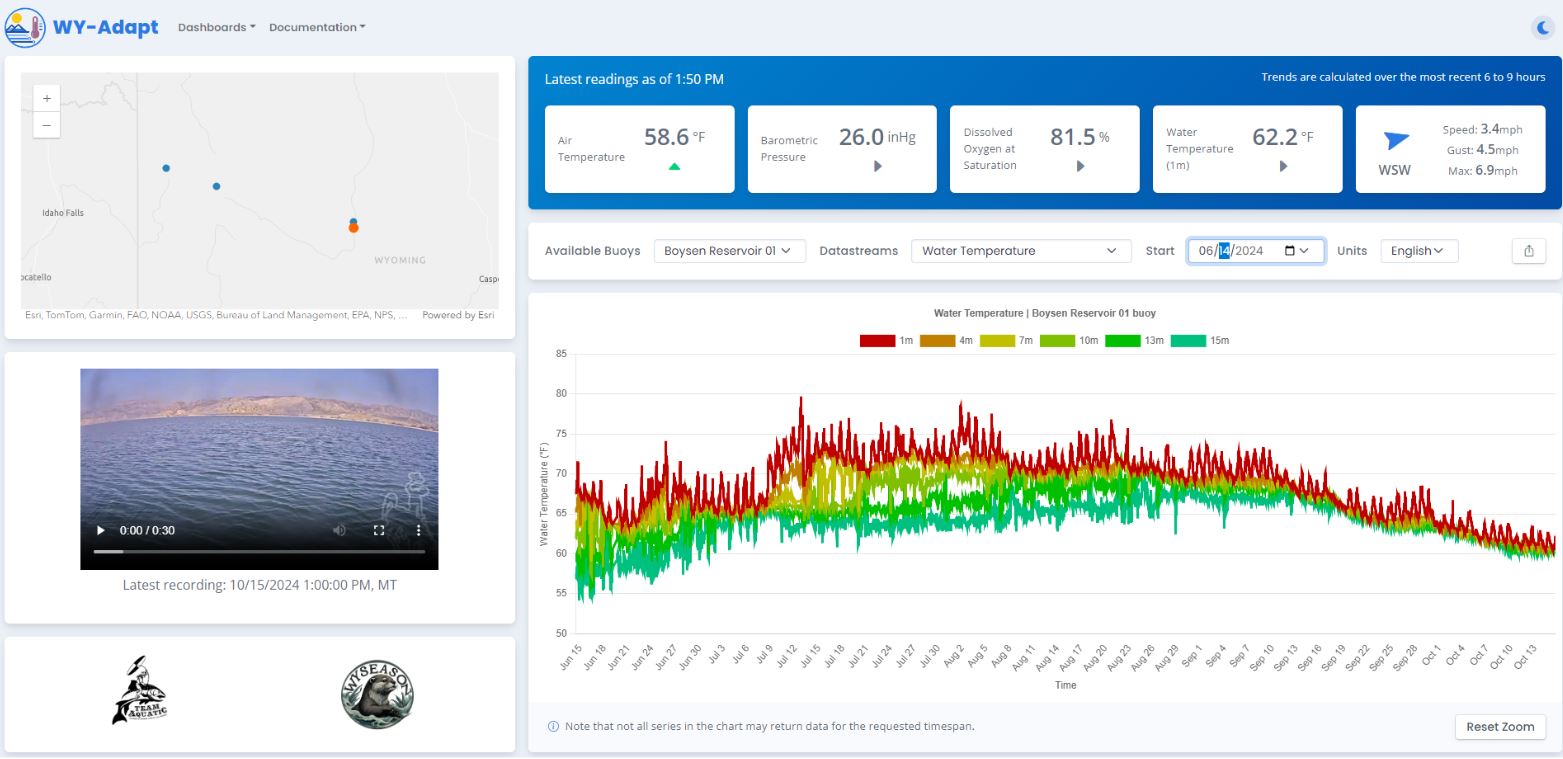 Data Check-In: Exploring Lake Trends with WY-Adapt
Posted on Dec 11, 2024
We designed this check-in to use an application dashboard from WY-Adapt created by the Wyoming Anticipating the Climate-Water Transition (WyACT) team at the University of Wyoming. WY-Adapt is an interactive, web-based data science platform designed to help communities across the Western United States explore and understand local climate projections. It transforms complex global climate model outputs into intuitive maps, charts, and datasets tailored to the region’s diverse environmental conditio
Data Check-in
Analyzing and Interpreting Data
WyAdapt Connected
Data Visualization
In the classroom
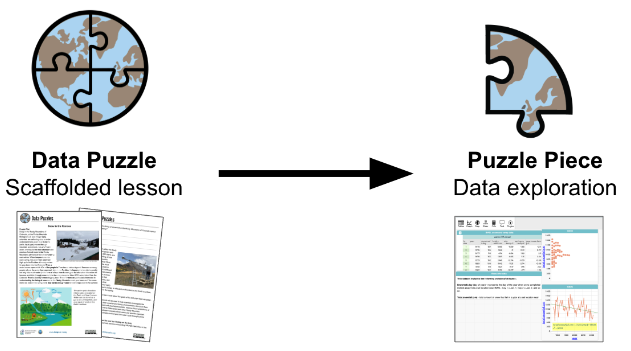 Data Check-in: Puzzle Pieces Connecting Students and Research
Posted on Nov 27, 2024
We designed this check-in to use parts of the Puzzle Pieces Collection within Data Puzzles, produced by the Cooperative Institute for Research in Environmental Sciences (CIRES) Center for Education, Engagement and Evaluation (CEEE) team. These CEEE resources are designed to make research, data, and researchers more accessible and engaging for students.
Data Check-in
Analyzing and Interpreting Data
In the classroom
Videos
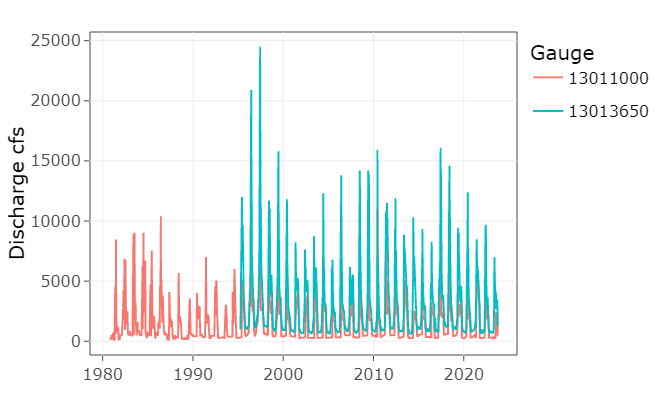 Stream Gauge Data Analysis Tool
Posted on Nov 13, 2024
The StreamGauge Data Analysis Tool enables users to download, analyze, and visualize streamflow data from the USGS with simple setup in R and RStudio. By plotting data from selected gauges to get annual value summaries, time-series trends can be derived. This is ideal for environmental science education and research.
RStudio
Analyzing and Interpreting Data
Data Visualization
In the classroom
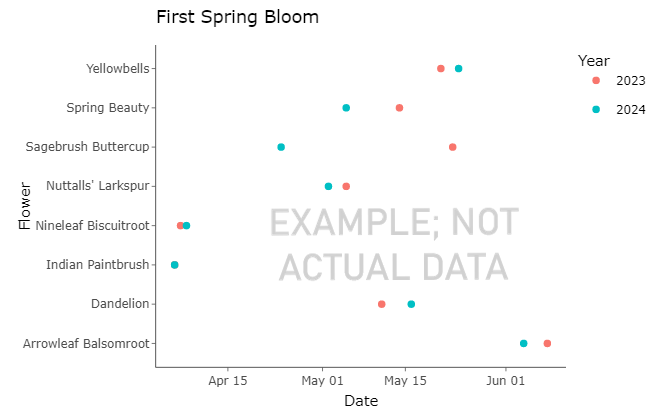 Wildflower Bloom Watch
Posted on Nov 11, 2024
Introducing our new Interactive Data Visualization Tool designed specifically for educators involved in classroom research. This tool enables you to collect, analyze, and visualize student data in real-time, enhancing your ability to make informed decisions and improve learning outcomes.
Analyzing and Interpreting Data
Data Visualization
RStudio
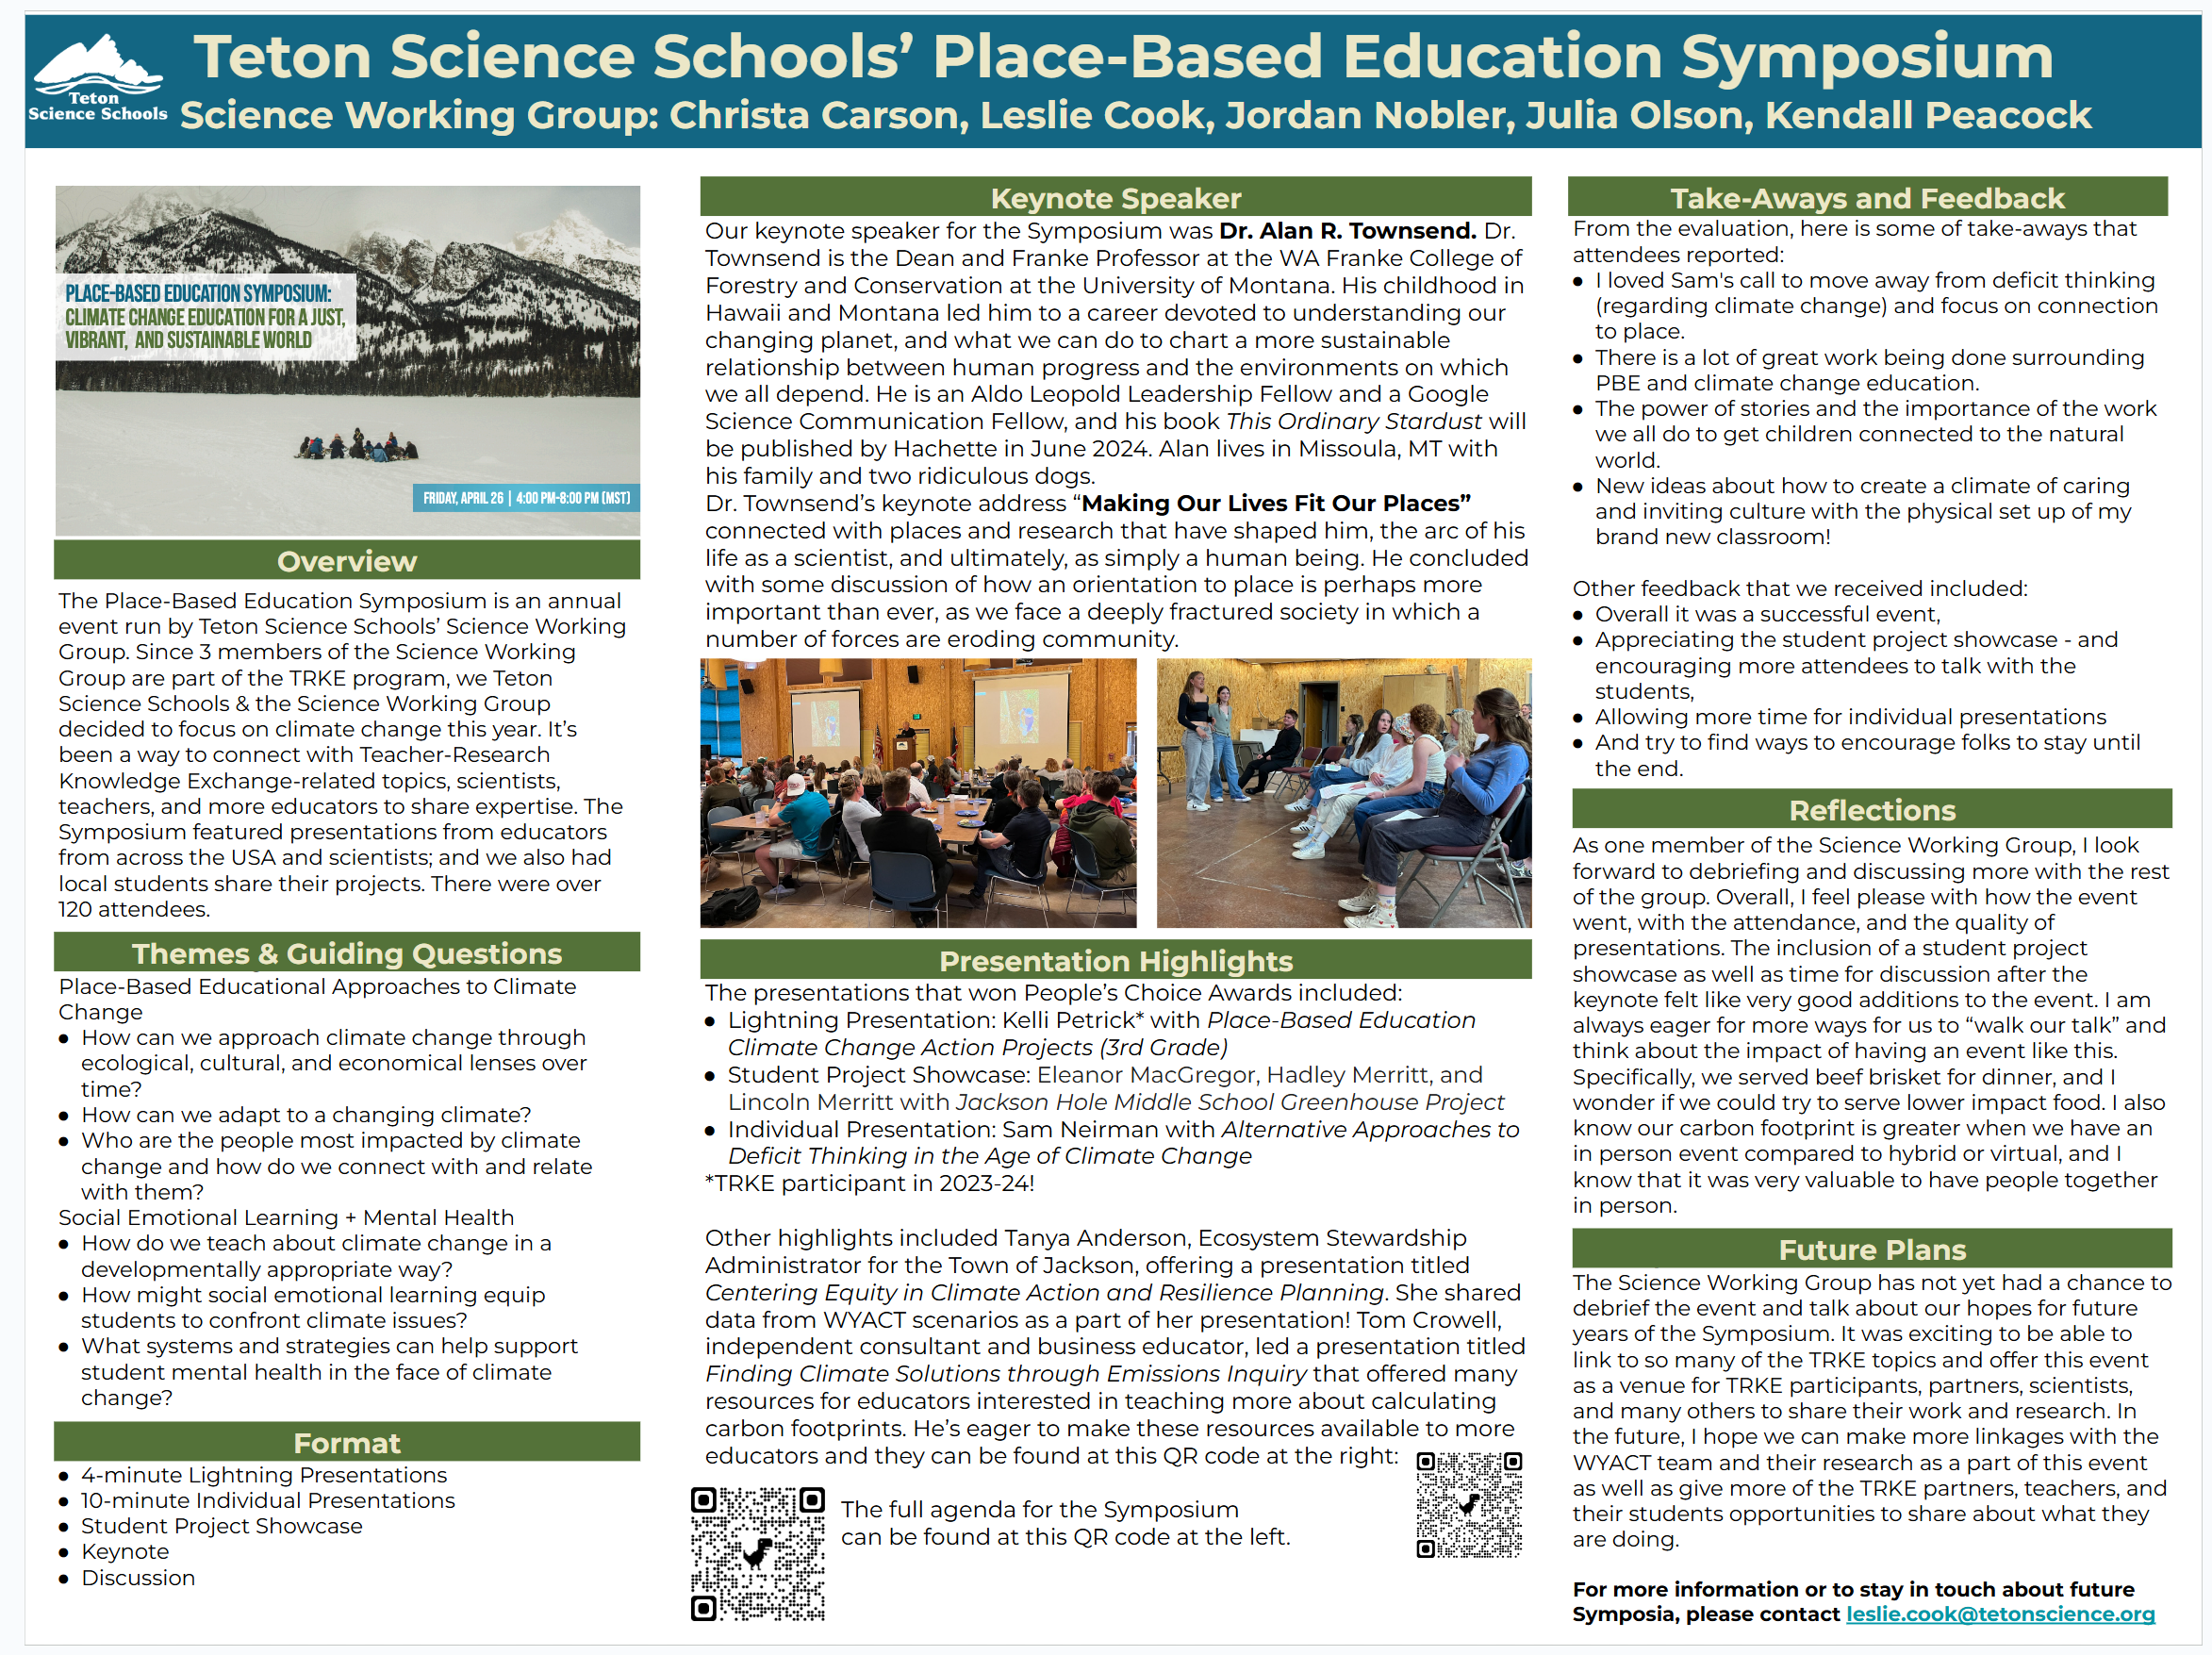 Highlights from the Teton Science Schools’ Place-Based Education Symposium
Posted on May 10, 2024
The Place-Based Education Symposium, organized by Teton Science Schools’ Science Working Group, focused on climate change this year, integrating themes from the Teacher-Researcher Knowledge Exchange (TRKE). With over 120 attendees, the event featured diverse presentations from educators across the USA, local students, and leading scientists, fostering a rich exchange of ideas and practices.
Community Engagement
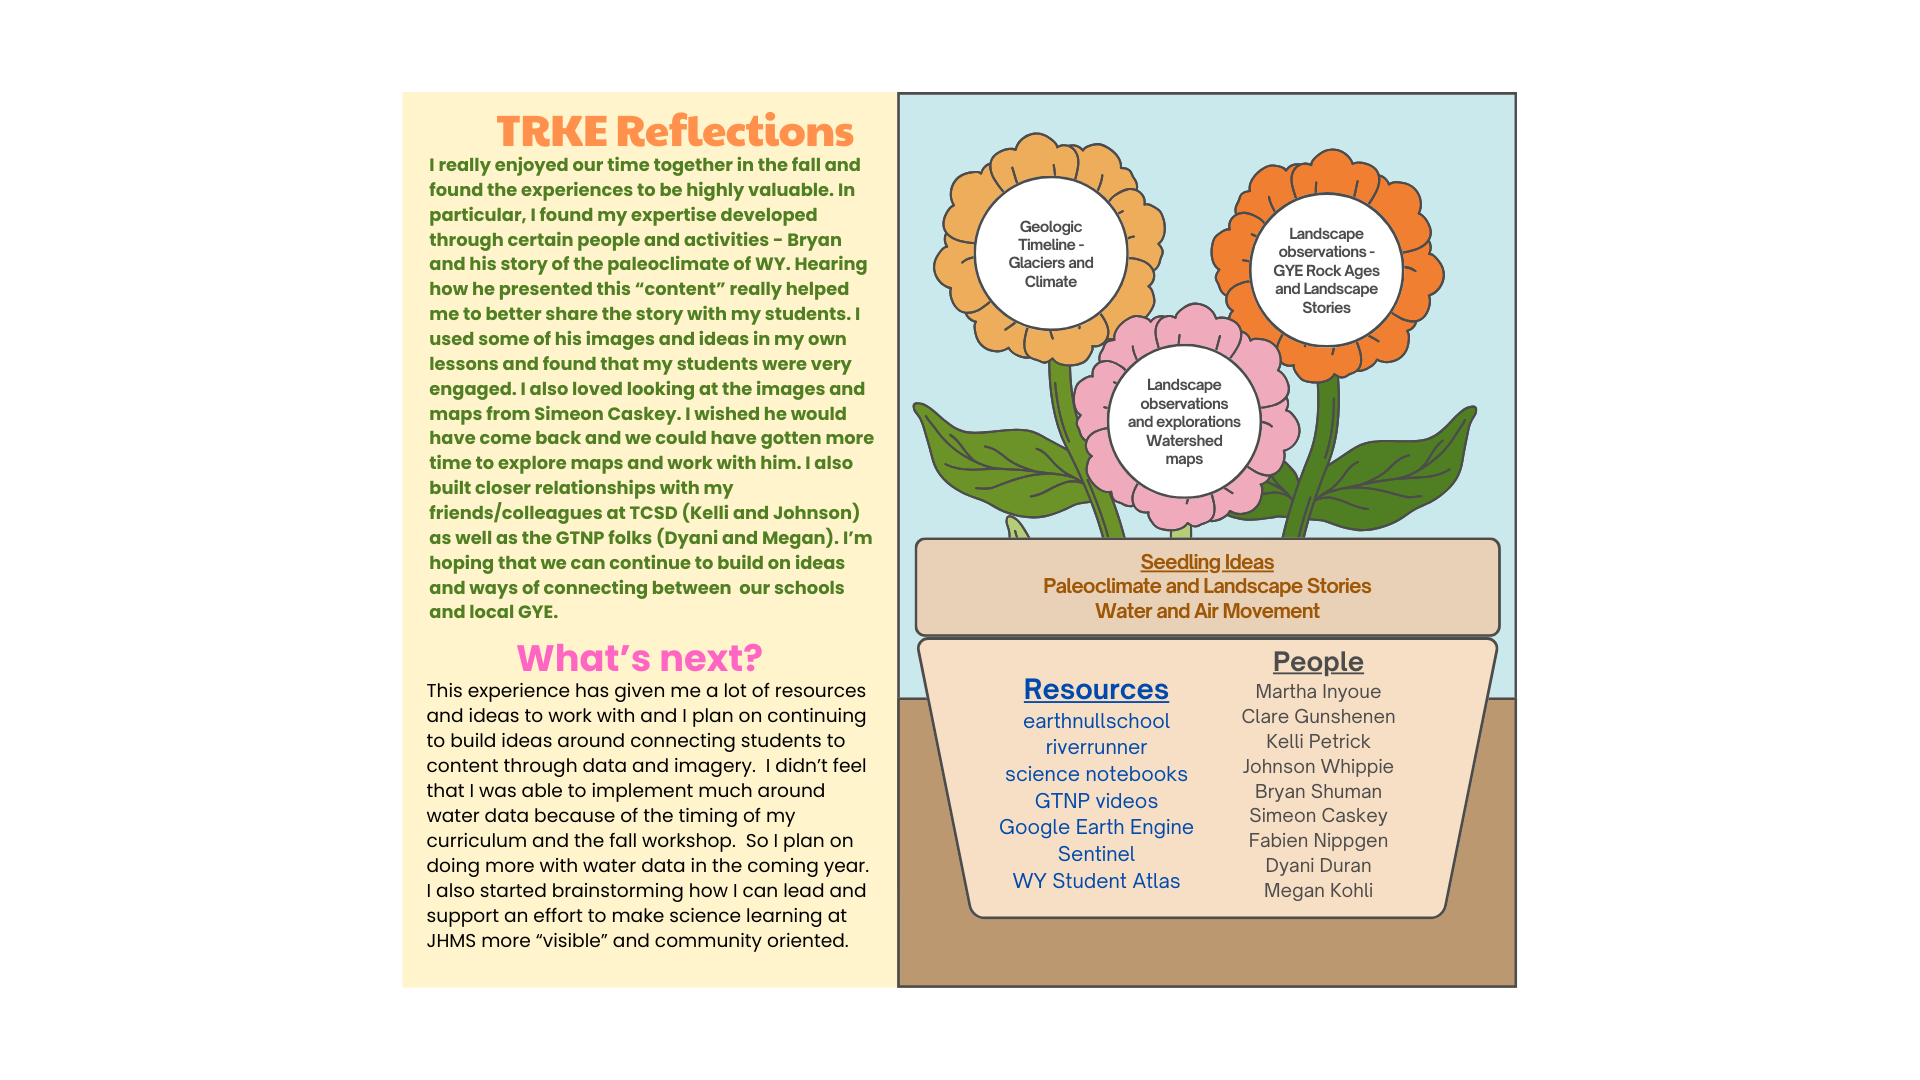 Integrating Real-World Science into Classrooms: Insights from Addie Deupree
Posted on May 10, 2024
In the fall, Addie Deupree participated in the TRKE program, engaging deeply with paleoclimate studies and educational practices. This experience enriched her teaching approach and significantly impacted her students’ understanding and interaction with the world around them.
Data Visualization
In the classroom
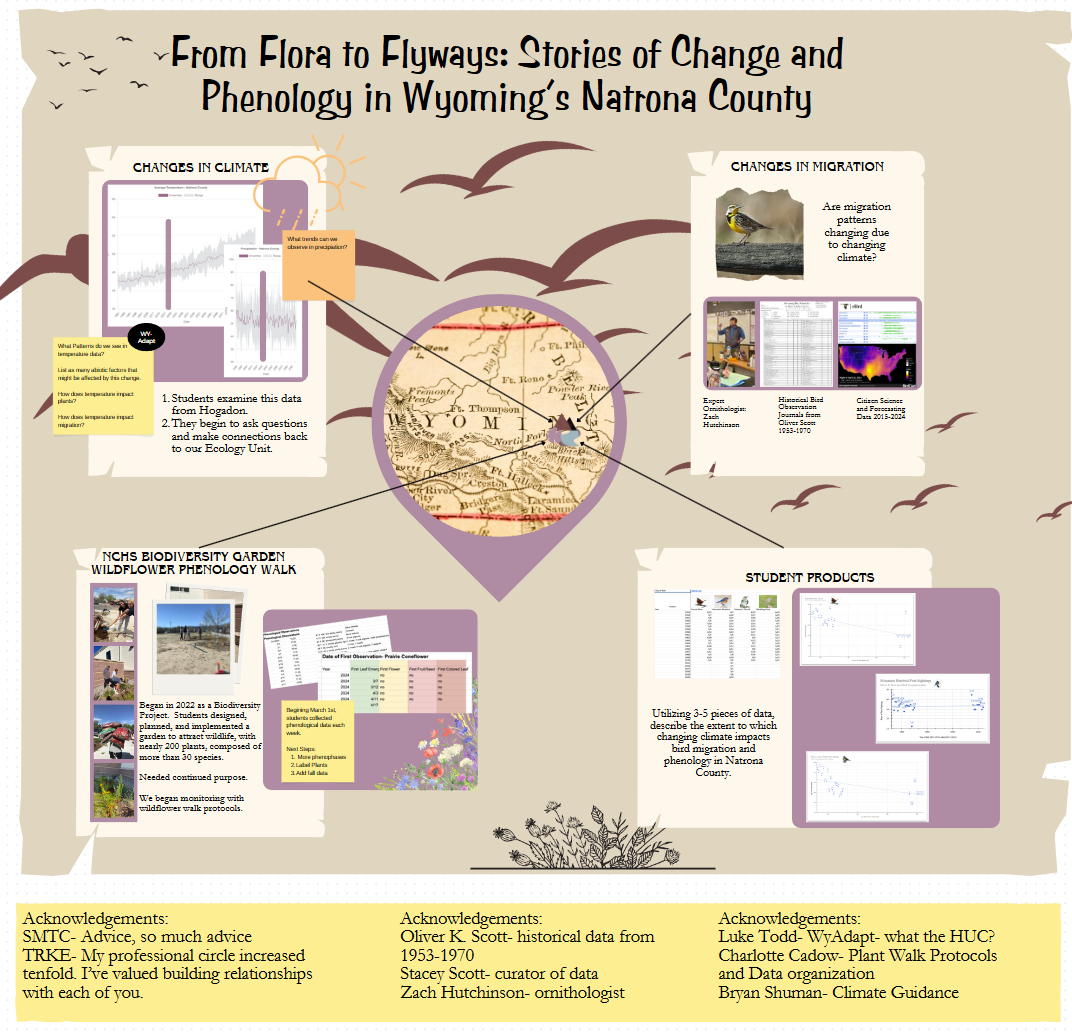 Exploring Changes in Flora and Fauna: A Phenological Study in Natrona County
Posted on May 10, 2024
This project, showcased by Jenny Edwards, delves into the intricate shifts in phenology observed within Wyoming’s Natrona County. By examining historical data and current observations, the project provides a comprehensive view of how local ecosystems adapt to climate change.
In the Field
Data Visualization
Community Engagement
Analyzing and Interpreting Data
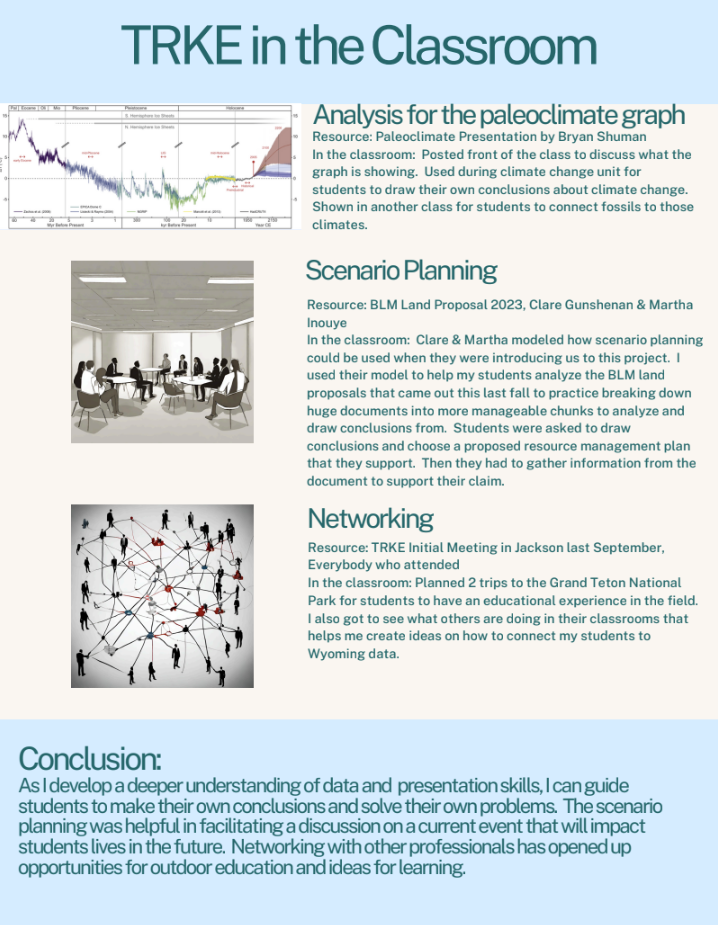 Enhancing Classroom Learning Through TRKE: Chelsea Lund's Approach
Posted on May 10, 2024
Chelsea Lund has effectively incorporated various TRKE resources into her classroom, enhancing student engagement and understanding of complex subjects like climate change and land management.
Scenario Thinking and Narratives
In the classroom
Analyzing and Interpreting Data
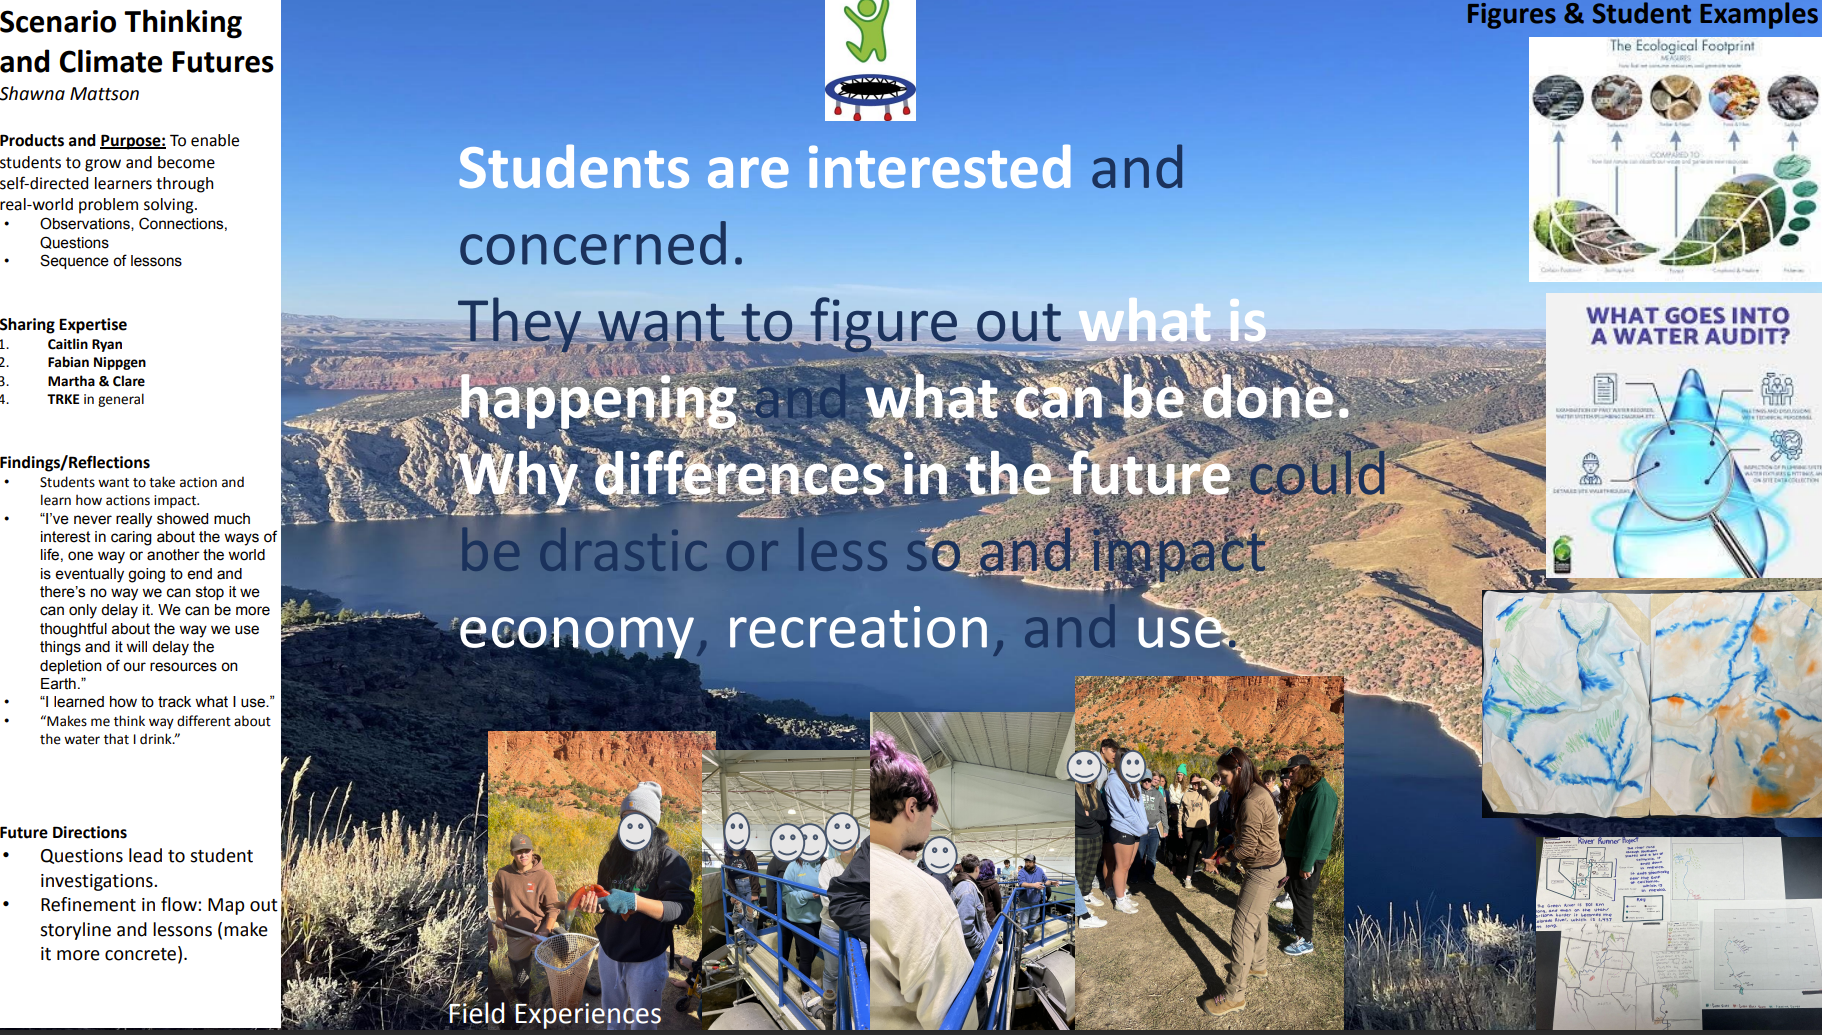 Empowering Students with Scenario Thinking in Climate Education
Posted on May 10, 2024
Shawna Mattson has incorporated a transformative approach in her classroom by integrating scenario thinking into climate education, aiming to empower students as self-directed learners engaged in real-world problem-solving.
Scenario Thinking and Narratives
In the classroom
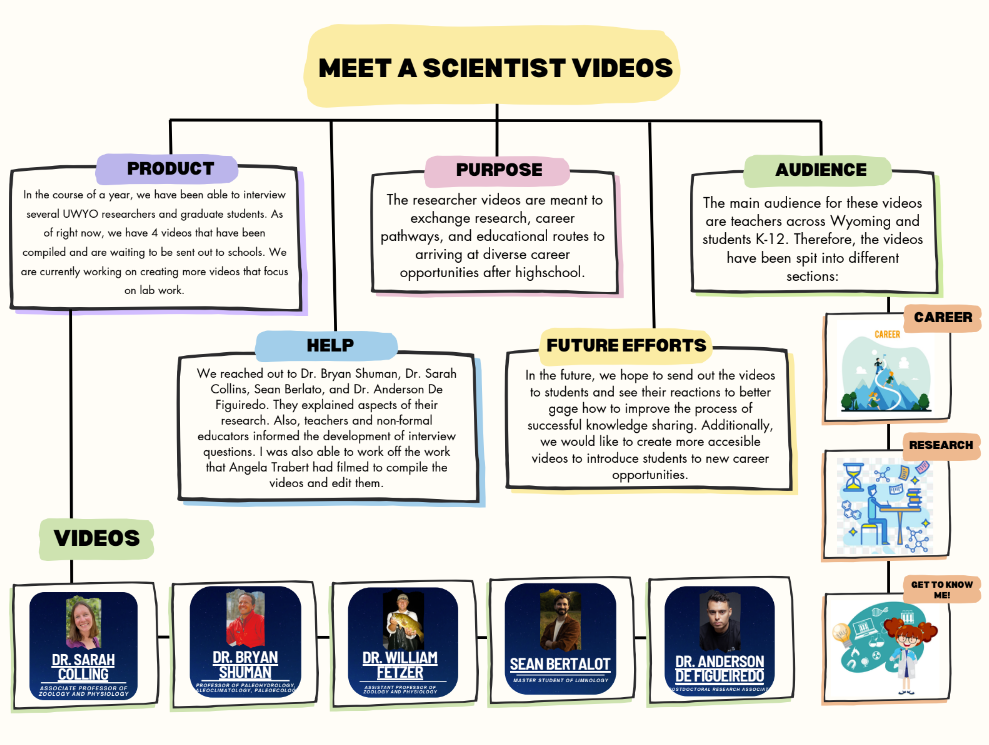 Meet a Scientist: Engaging K-12 Students with Real-World Researchers
Posted on May 10, 2024
Juana Rodriguez has spearheaded an exciting initiative to create engaging video content featuring UWYO researchers and graduate students. These videos serve as a bridge connecting K-12 students with the world of scientific research, offering insights into diverse career pathways in science.
Career Connections
Videos
In the classroom
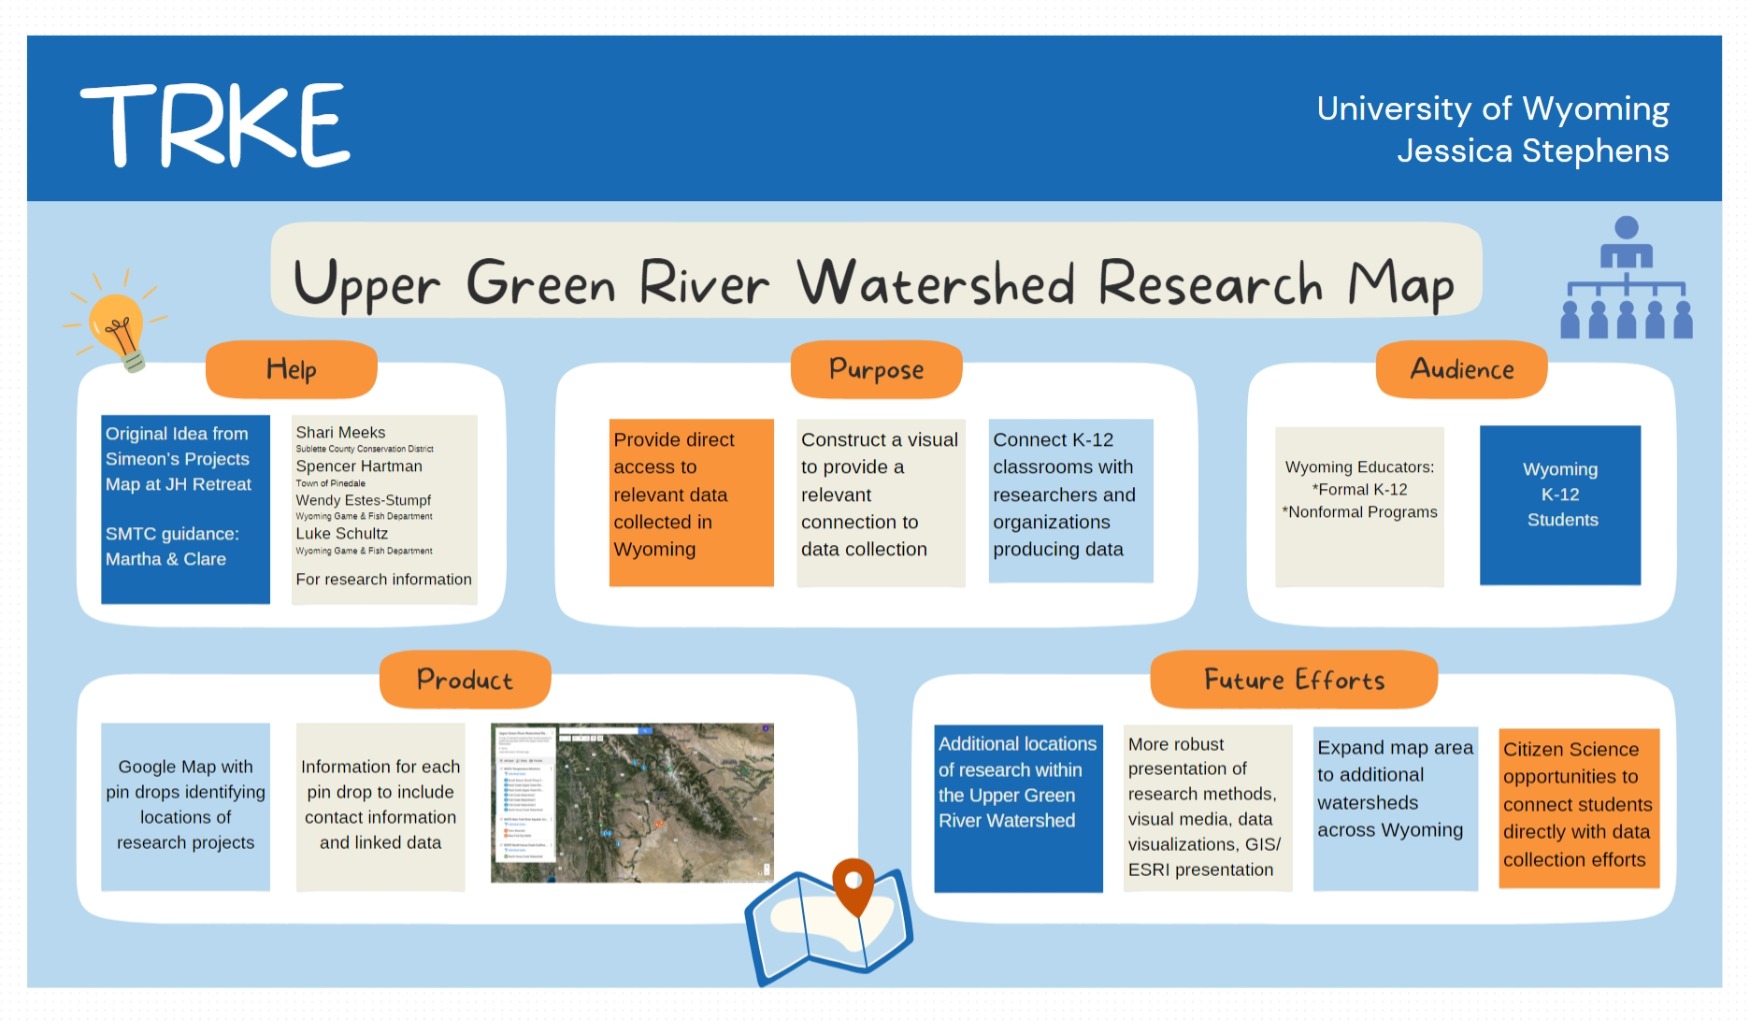 Mapping the Upper Green River Watershed: A Tool for Education and Research
Posted on May 10, 2024
Jessica Stephens from the University of Wyoming has developed an interactive map detailing various research projects throughout the Upper Green River Watershed. This map serves as a vital educational tool, providing direct access to geospatial data collected in Wyoming.
In the classroom
Data Visualization
Student Research
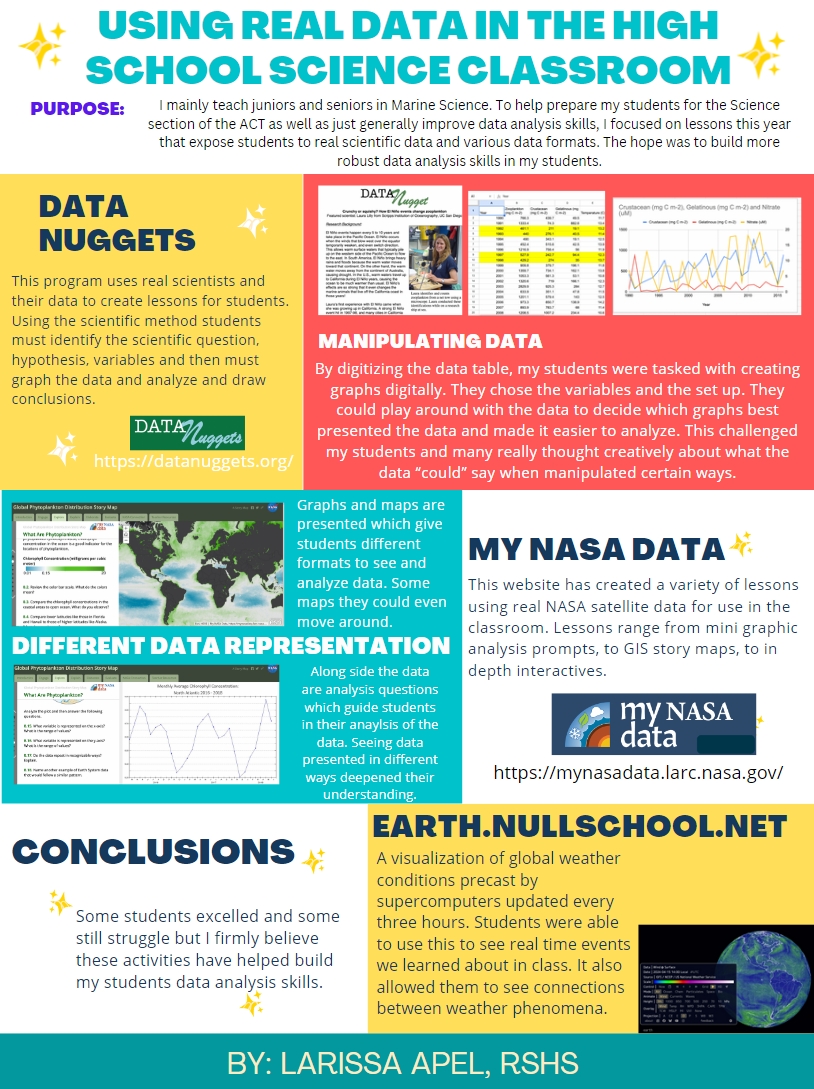 Enhancing Data Analysis Skills in Science Education with Real Data
Posted on May 10, 2024
Larissa Apel, a high school science teacher, focuses on using real-world data to enhance the analytical skills of juniors and seniors in Marine Science. Her approach involves integrating tools and resources that expose students to scientific data and various data formats to build robust data analysis skills.
Analyzing and Interpreting Data
Data Visualization
In the classroom
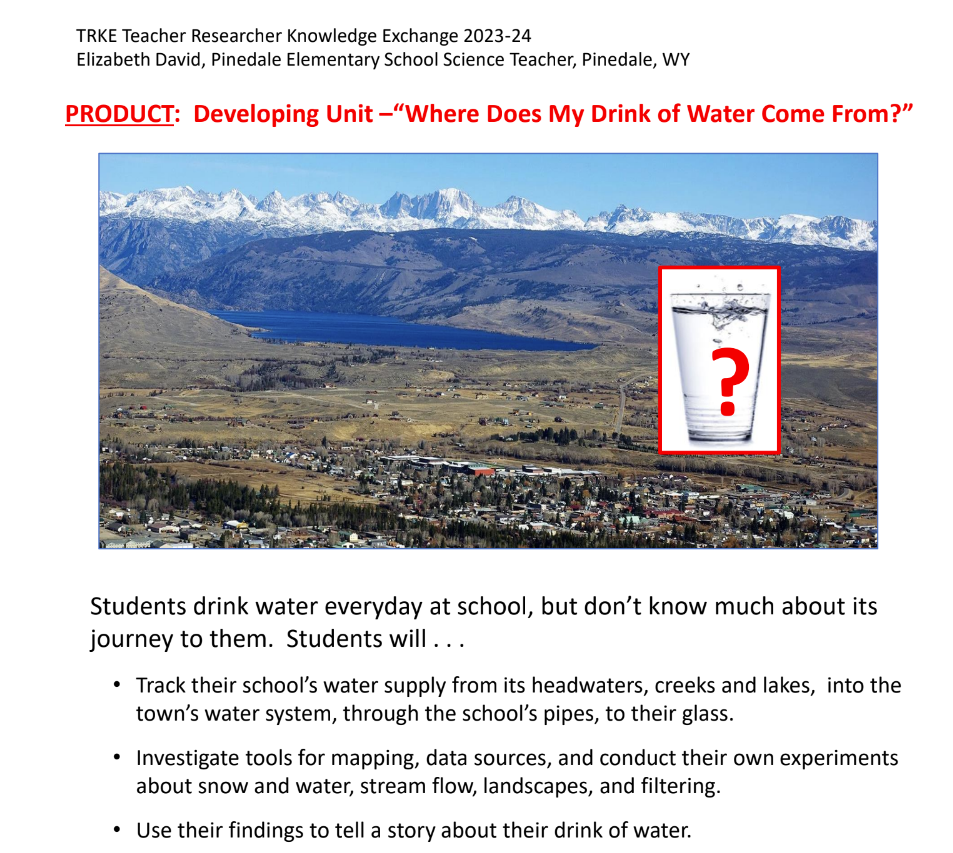 Exploring the Journey of Water: An Educational Unit by Elizabeth David
Posted on May 10, 2024
Elizabeth David, a science teacher at Pinedale Elementary School, has developed an innovative educational unit titled "Where Does My Drink of Water Come From?" This unit is designed to teach students about the journey of water from its source to their school faucets, integrating various data tools and resources to enhance learning.
Analyzing and Interpreting Data
In the classroom
Data Visualization
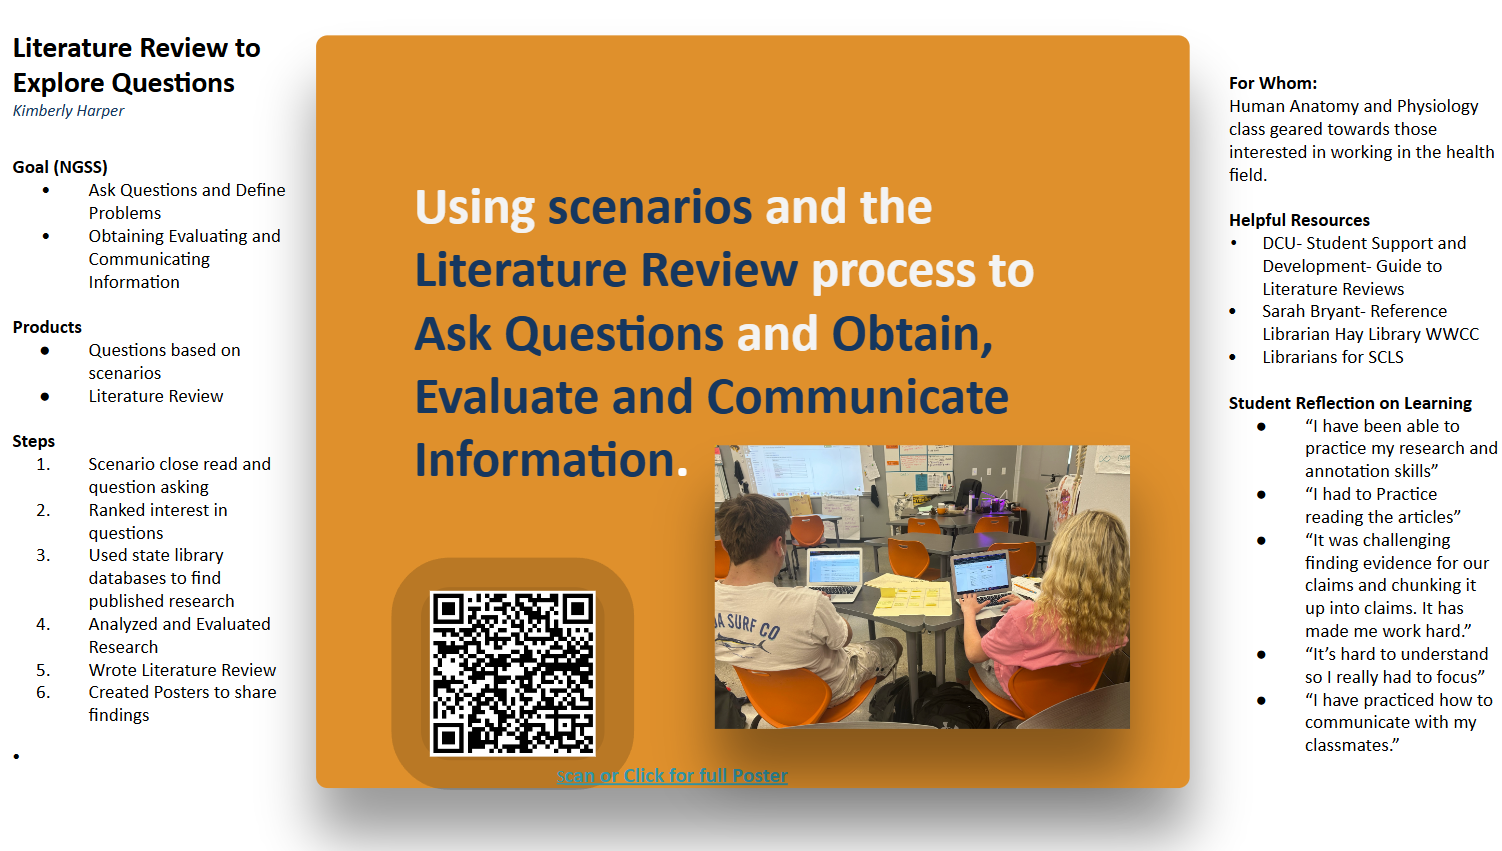 Empowering Students Through the Literature Review Process in Health Sciences
Posted on May 10, 2024
Kimberly Harper has introduced a rigorous literature review process in her Human Anatomy and Physiology class, aimed at students interested in the health field. This approach helps students develop critical research skills needed for their future careers.
Student Research
In the classroom
Analyzing and Interpreting Data
Career Connections
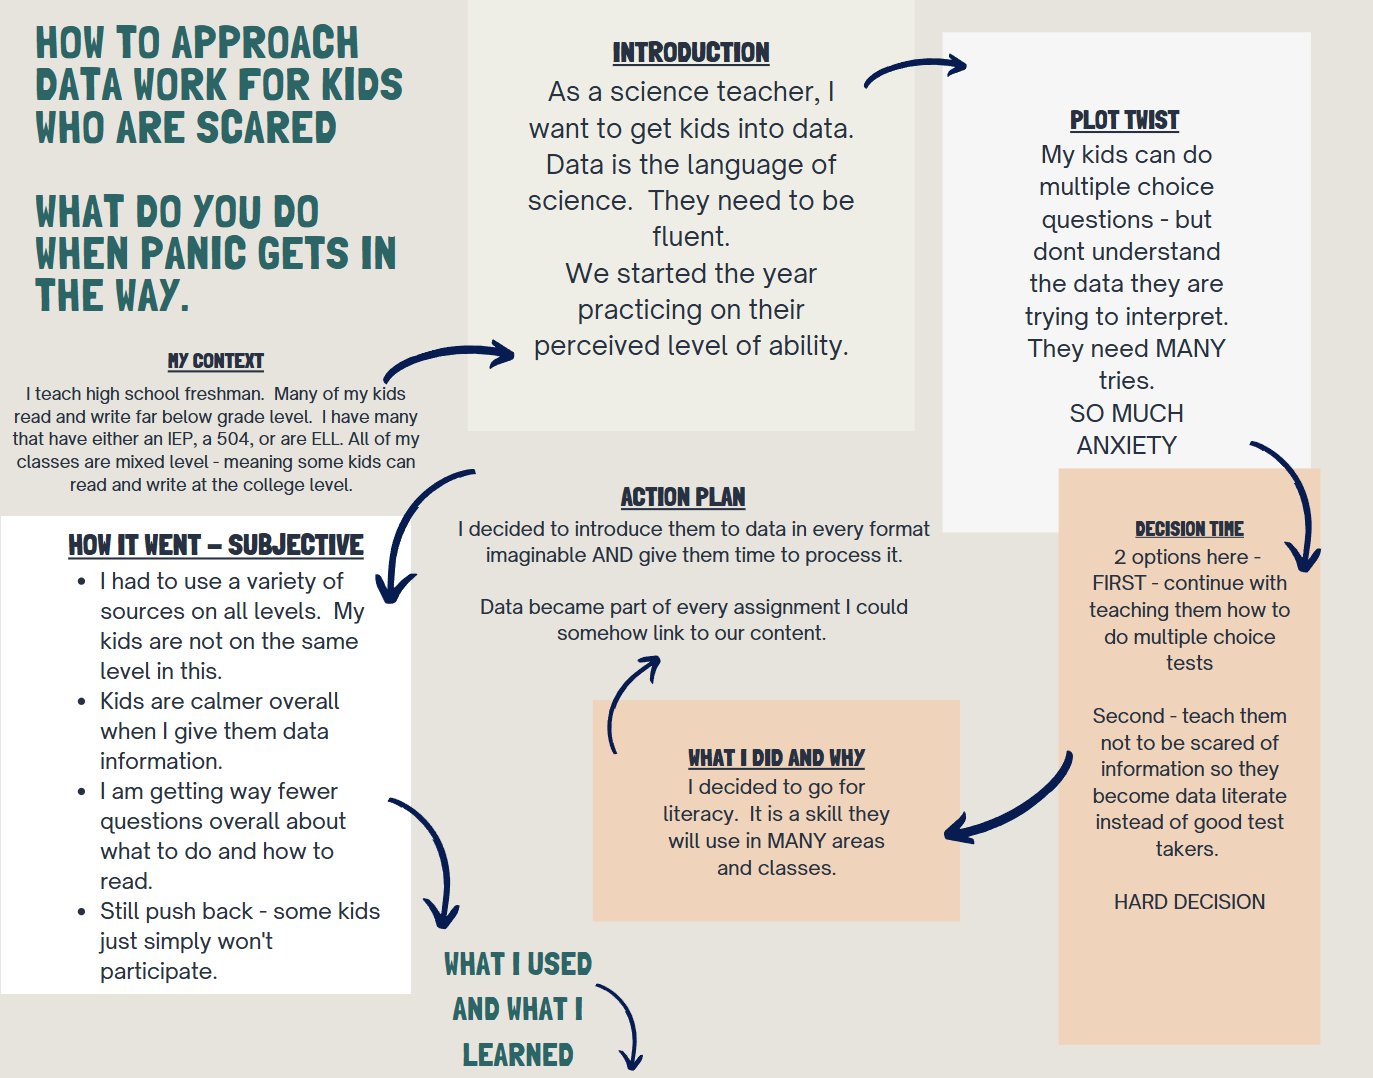 Building Data Literacy in High School Freshmen: Overcoming Anxiety and Embracing Curiosity
Posted on May 10, 2024
In an innovative approach to education, a high school teacher has developed a program designed to help freshmen overcome their anxiety around data and engage more deeply with scientific inquiry. This initiative is part of an effort to make data literacy a core part of the educational experience, recognizing the importance of data fluency in today’s information-driven world.
Scenario Thinking and Narratives
In the classroom
Data Visualization
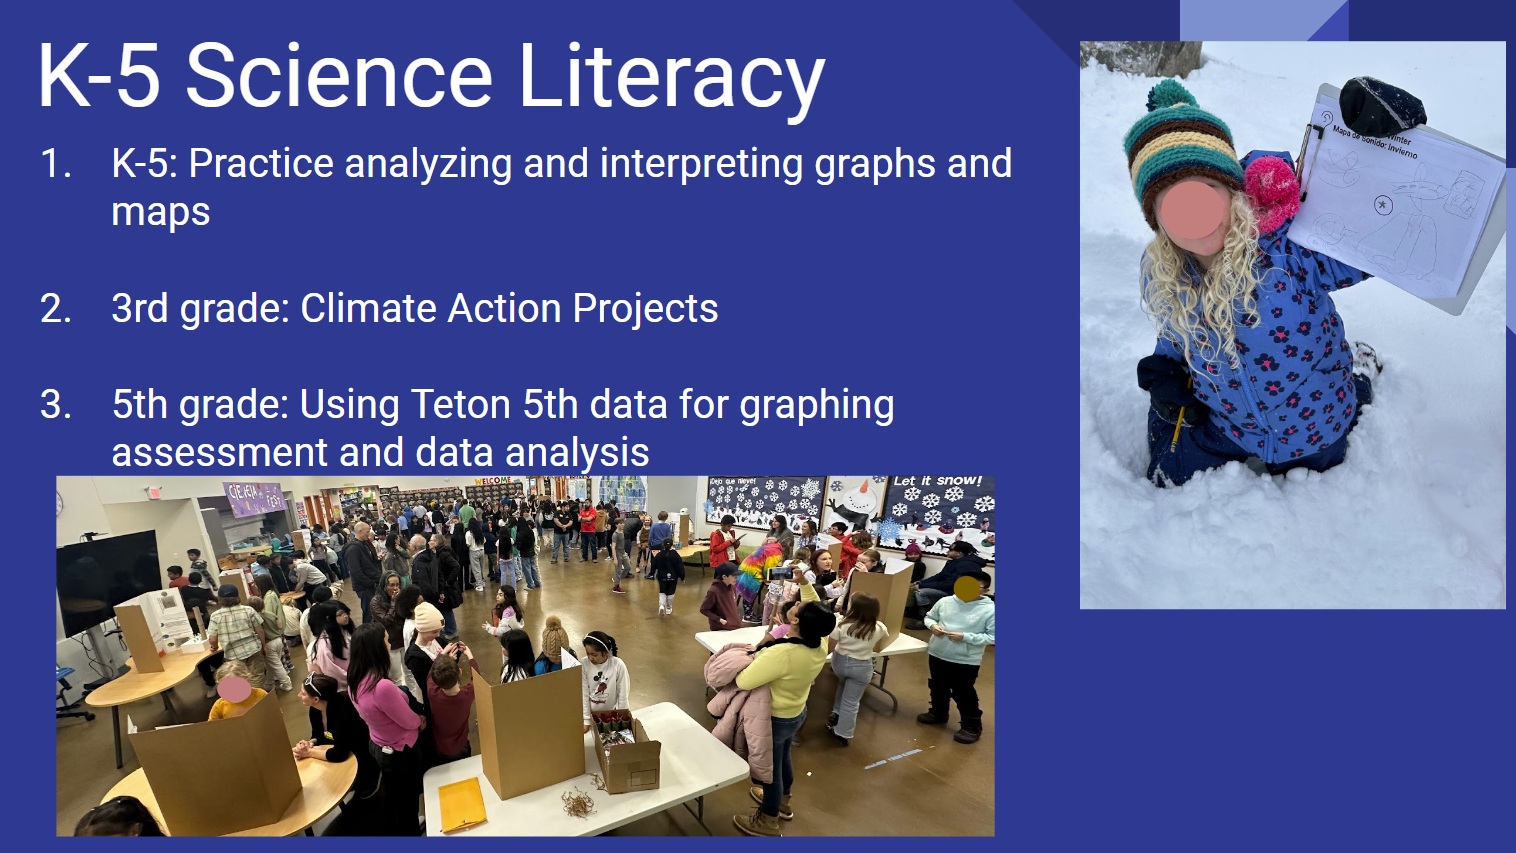 Building Science Literacy in K-5: Graphing, Climate Action, and Data Interpretation
Posted on May 10, 2024
Kelli Petrick has developed a comprehensive science literacy program for K-5 students, focusing on improving their ability to analyze and interpret graphs and maps. Her approach integrates hands-on projects with real-world data to help students become proficient in scientific communication by the time they complete elementary school.
Analyzing and Interpreting Data
Climate Data
In the classroom
Data Visualization
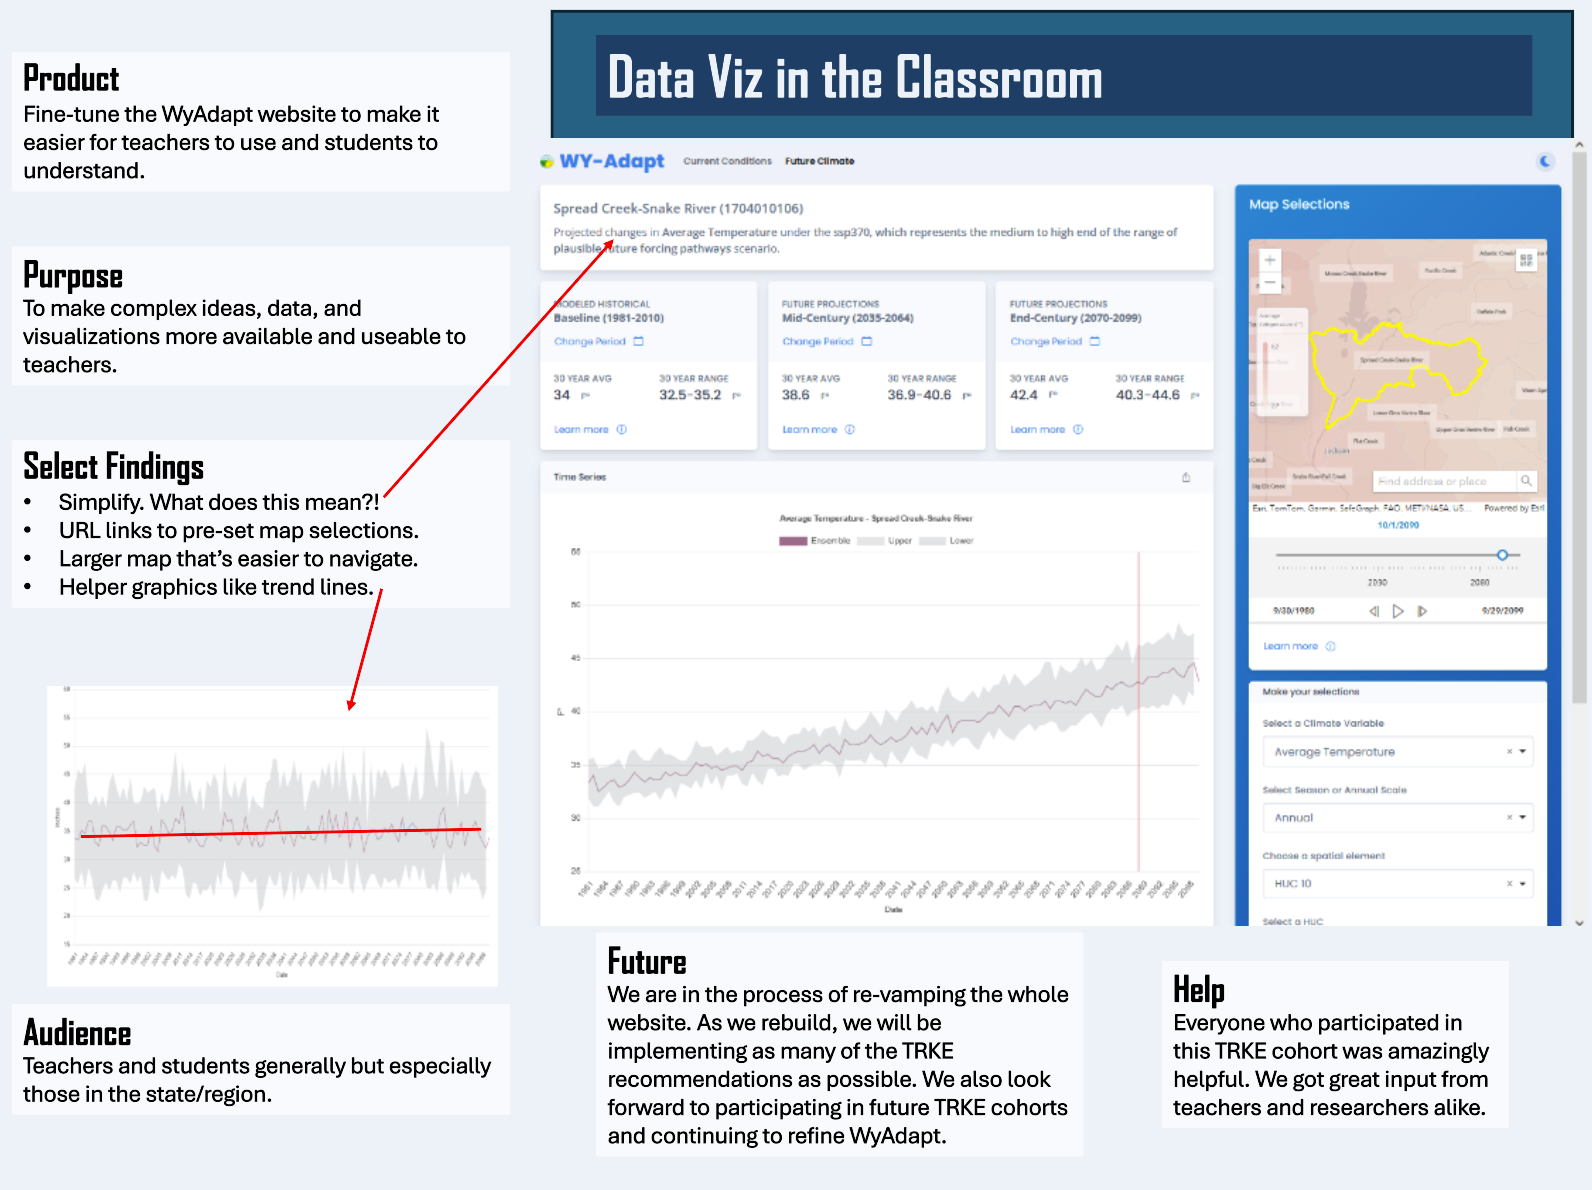 Data Visualization in the Classroom: Using WY-Adapt to Enhance Learning
Posted on May 10, 2024
Luke Todd's presentation, titled "Data Visualization in the Classroom," focuses on using data visualization tools to enhance student engagement and understanding, particularly in the context of climate and water education. Using the WY-Adapt program as an example, he explores how data visualization can make complex scientific data more accessible to K-12 students.
Data Visualization
Climate Data
WyAdapt Connected
In the classroom
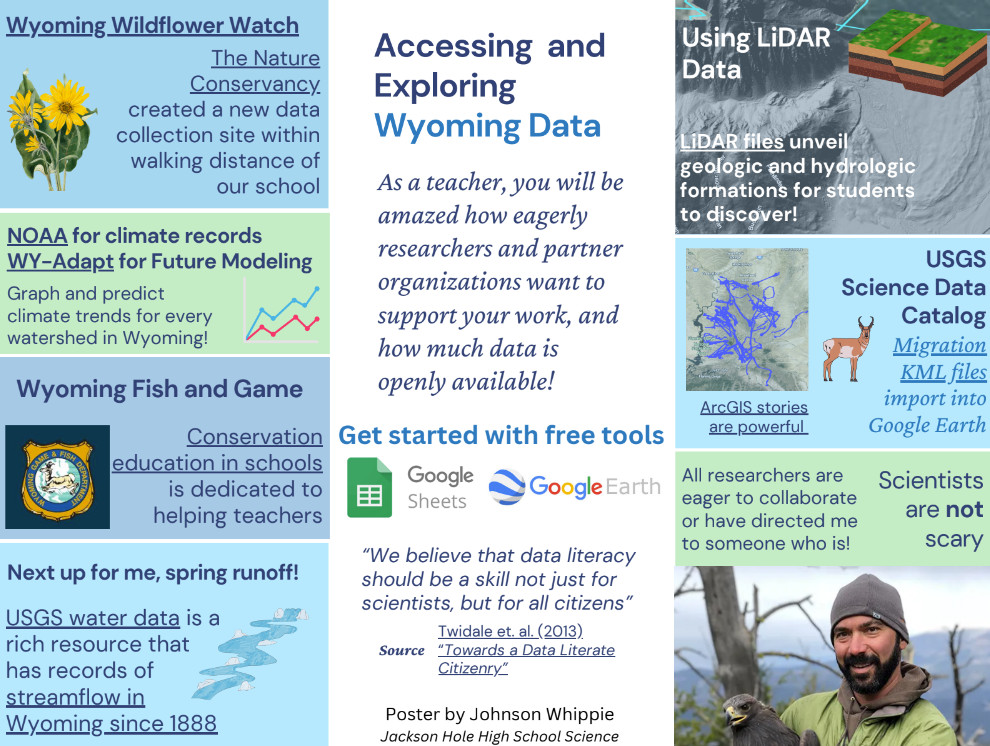 Accessing and Exploring Wyoming Data: Engaging Students with Free Tools and Local Resources
Posted on May 10, 2024
Johnson Whippie’s project focuses on empowering teachers and students to access and explore publicly available data related to Wyoming’s natural environment. By utilizing free tools like Google Earth, USGS datasets, and NOAA records, students can engage in hands-on learning that deepens their understanding of local ecosystems and climate trends.
Climate Data
In the classroom
No posts match the current filter.
WY-Adapt Data Repository | © 2026 | v2.0.0
Funding provided by Grant: NSF OIA 2149105
Funding provided by Grant: NSF OIA 2149105