


Data Check-In: "Taking the Temperature of WY Public Opinion on Adapting to Climate & Water Change”
We designed this check-in to use a climate opinion survey to demonstrate how qualitative data can provide context for conversations around complex issues. Qualitative data provides students insight into people's experiences, thoughts and feelings and helps explain the "why" behind phenomena.
Posted on Feb 11, 2025
Data Check-ins: We include a data-inspired check-in to start each of our TRKE virtual sessions. We aim for these check-ins to be useful for our cohort's shared learning, but also hope our framing and the resources we share might be useful to other folks. We encourage you to look through this data-inspired check-in, explore the resources we use, engage with our prompts, and consider whether you'd be able to adapt this progression for your own context. Check out an example, below, to see if it might be for you, and explore our other posts with the “data check-in” tag to see other examples we’ve used.
Facilitator Context: We designed this check-in to use a climate opinion survey to demonstrate how qualitative data can provide context for conversations around complex issues. Qualitative data provides students insight into people's experiences, thoughts and feelings and helps explain the "why" behind phenomena.
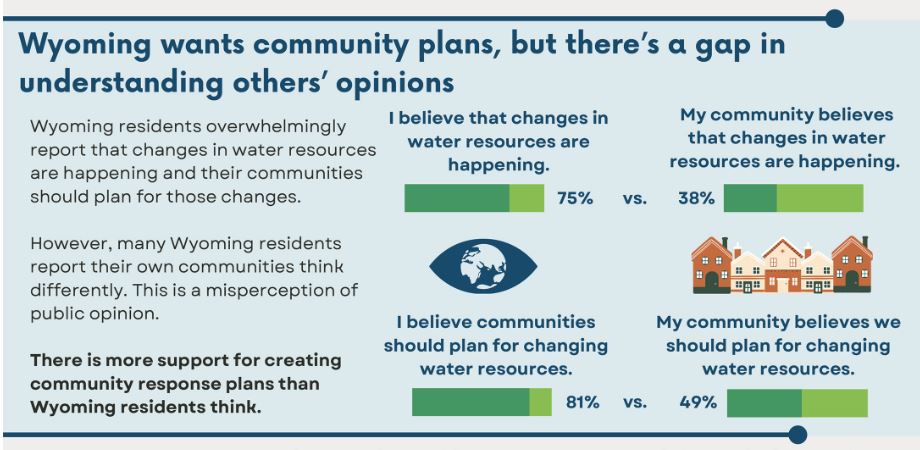
During our January 30th, 2025 Virtual Session we demonstrated a Data Check-in using infographics created from a statewide survey of 500 residents on their views of Wyoming's changing water and changing climate. We used the following framing to engage teachers in the resource.
Visit The Wyoming Survey on Climate, Water, and People dashboard to find the full survey report, explore the full infographic, and navigate the different survey questions by demographic and question.
Framing & Flow: After opening the infographics page, the facilitators provided a brief overview of the infographics:
"The first infographic shows the demographics of the survey, which were representative of different genders, age groups, levels of education, etc. across Wyoming. The second infographic summarizes takeaways from the survey questions."
Then participants were given time to individually explore the infographics while considering the following questions:
-
- "What are Wyoming's opinions?"
- "Given the survey context, do we have enough evidence to use these findings?"
- "What questions does this spark for you?"
Following the exploration time, participants were asked to share their observations with the group.
A Data Check-in Skeleton: These are the general steps we include in all of our data check-ins.
- Consider a shared context and/or puzzling idea.
- Analyze/interpret a related dataset to explore trends, gather evidence, and test initial ideas.
- Reflect on what can be uncovered in these data, what new questions arise, and where you connect to ideas of uncertainty.
- Come together to share takeaways and connections to learners' own interests and contexts.
Reflect on How You Might Connect to these Ideas:
- How could you incorporate similar data exploration activities in your own context?
- What tools or ideas could help learners engage with real-world data?
- How might current research or researchers and interactive datasets enrich your teaching strategies?
Funding provided by Grant: NSF OIA 2149105