

Data Check-In: Data Exploration Through Fact Sheets
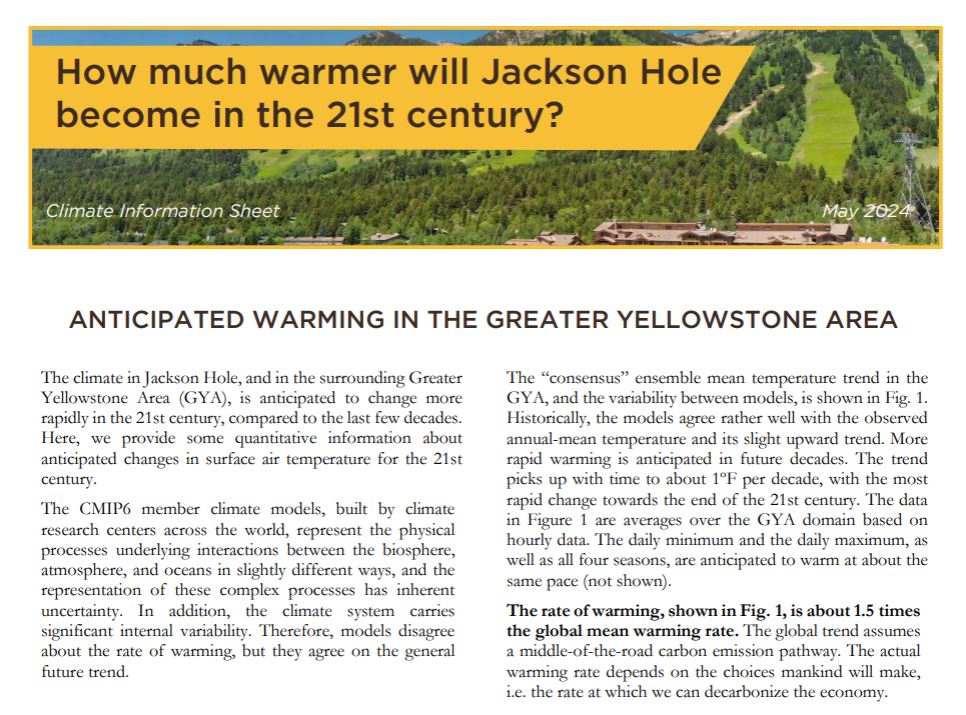
We designed this check-in to use 1-page handouts called "factsheets" that synthesize climate and water data into an accessible format. Each factsheet centers around a question people might be interested in and tries to provide a short answer to that question. They are being created by University of Wyoming researchers to disseminate research into the public's hands to facilitate meaningful engagement and real-world application.
Posted on Mar 11, 2025
Data Check-ins: We include a data-inspired check-in to start each of our TRKE virtual sessions. We aim for these check-ins to be useful for our cohort's shared learning but also hope our framing and the resources we share might be useful to other folks. We encourage you to look through this data-inspired check-in, explore the resources we use, engage with our prompts, and consider whether you'd be able to adapt this progression for your own context. Check out an example, below, to see if it might be for you, and explore our other posts with the “data check-in” tag to see other examples we’ve used.
Facilitator Context: We designed this check-in to use 1-page handouts called "factsheets" that synthesize climate and water data into an accessible format. Each factsheet centers around a question people might be interested in and tries to provide a short answer to that question. They are being created by University of Wyoming researchers to disseminate research into the public's hands to facilitate meaningful engagement and real-world application.
Here are links to the two factsheets we used:
- How much warmer will Jackson Hole become in the 21st century?
- How are Jackson Hole temperatures changing?
To view more of these factsheets, see links under "Jackson Hole" here: Information Material
Framing & Flow: The factsheet is introduced as a slow reveal. Facilitators only showed the High (Day) Low (Night) graph and provided time for participants to explore in pairs:
-
- "What's going on in this graph?"
- "What do you notice and wonder?"
Participants were asked to share their observations. Once the trend is shared that nighttime lows are increasing is shared, the facilitator asked participants to discuss:
-
- "Why do nighttime temperatures matter?"
After brainstorming, participants were asked to read the fact sheet and consider how it connects to/explains the graph and its importance. They were then given the following prompts:
-
- "What do you notice and wonder now?"
- "What about the factsheet explanations are satisfying or not?
- "What makes them satisfying or not?"
Following the exploration time, participants were asked to share their observations with the group.
A Data Check-in Skeleton: These are the general steps we include in all of our data check-ins.
- Consider a shared context and/or puzzling idea.
- Analyze/interpret a related dataset to explore trends, gather evidence, and test initial ideas.
- Reflect on what can be uncovered in these data, what new questions arise, and where you connect to ideas of uncertainty.
- Come together to share takeaways and connections to learners' own interests and contexts.
Reflect on How You Might Connect to these Ideas:
- How could you incorporate similar data exploration activities in your own context?
- What tools or ideas could help learners engage with real-world data?
- How might current research or researchers and interactive datasets enrich your teaching strategies?
Related Educational Resources
Funding provided by Grant: NSF OIA 2149105