

Data Check-In: Macros as Indicators
During our December 9th, 2025 Virtual Session we had participants engage with macroinvertebrate data collected by the Sublette County Conservation District. Many of our educators have used macroinvertebrate data in their classrooms, so we wanted to provide them an opportunity to deepen their understanding of how this data is collected by inviting guest researchers, Sam Dilworth and Adrienne Kirkwood, to share their perspectives on macroinvertebrate analysis and field-based data collection. Throu
Posted on Jan 13, 2026
Data Check-ins: We include a data-inspired check-in to start each of our TRKE virtual sessions. We aim for these check-ins to be useful for our cohort's shared learning but also hope our framing and the resources we share might be useful to other folks. We encourage you to look through this data-inspired check-in, explore the resources we use, engage with our prompts, and consider whether you'd be able to adapt this progression for your own context. Check out an example, below, to see if it might be for you, and explore our other posts with the “data check-in” tag to see other examples we’ve used.
Facilitator Context: During our December 9th, 2025 Virtual Session we had participants engage with macroinvertebrate data collected by the Sublette County Conservation District. Many of our educators have used macroinvertebrate data in their classrooms, so we wanted to provide them an opportunity to deepen their understanding of how this data is collected by inviting guest researchers, Sam Dilworth and Adrienne Kirkwood, to share their perspectives on macroinvertebrate analysis and field-based data collection. Throughout the check-in, participants engaged in individual, whole-group, and small group discussions that supported collaborative sense-making and reflection around uncertainty in data.
For additional information on macroinvertebrates check out this brief overview created by Sam: Macros Handout
Framing & Flow:
We began this check-in by inviting the whole group to consider the following questions about macroinvertebrates as indicator species:
-
- "Why are they indicators?"
- "How are they indicators?"
- "And indicators for what?"
- "Why might we want to look at macros?"
Participants shared initial ideas with the group. Then they were provided with the following summary about macroinvertebrates to support discussion in small groups:
“Macroinvertebrates have a wide range of tolerances and adaptations that can be leveraged to monitor changes in lake and stream conditions over time. For instance, many insects are cold adapted or pollution intolerant and may disappear once water temperature or pollution increases. Because they are easy to sample and represent an entire year of aquatic condition, macroinvertebrate data is often the only data we have in small ungauged streams.”
Next, participants moved into small groups to discuss the following prompt:
-
- “How can macroinvertebrates help expose productive uncertainty within the spaces where we might find them or collect data on them?”
Following the small group discussion, groups shared where their conversations went with the larger group.
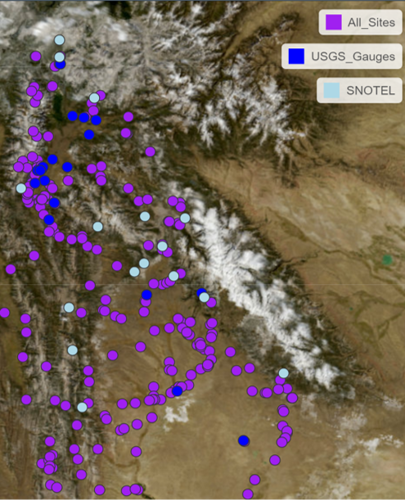
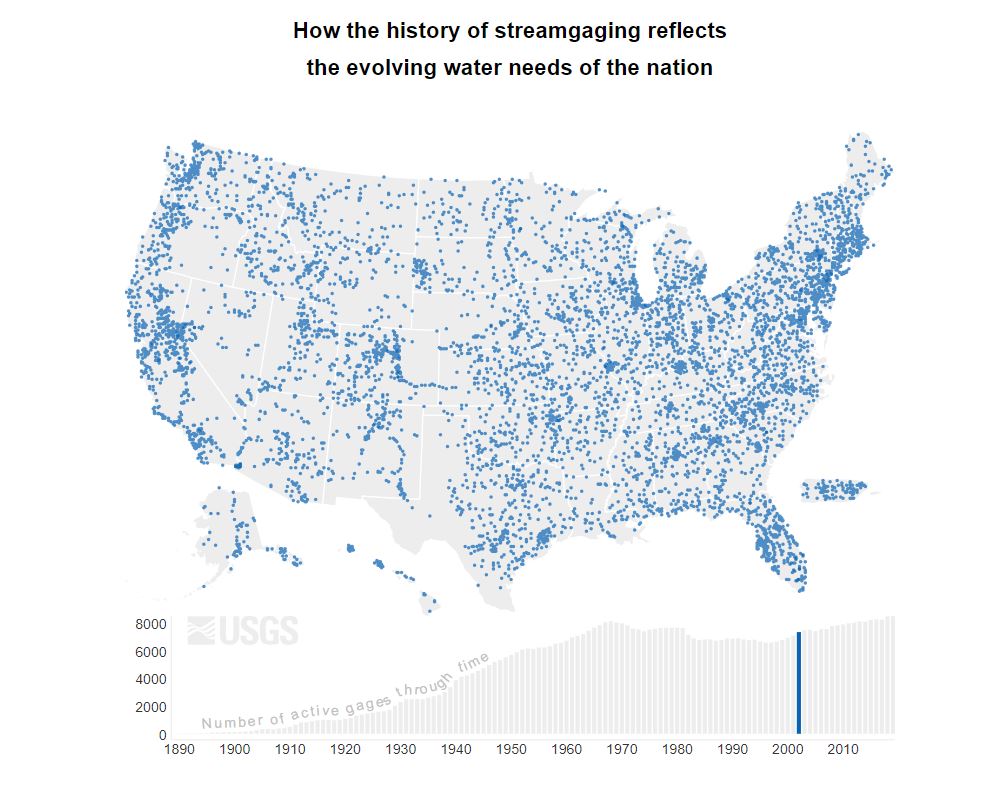
Next, facilitators layered in a map showing USGS stream gauges, SNOTEL sites, and macroinvertebrate sampling locations created by one of the guest researchers.
-
- Blue Dots = USGS Stream Gauges
- Light Blue Dots = SNOTEL Sites
- Purple Dots = Places macroinvertebrates have been sampled at least once
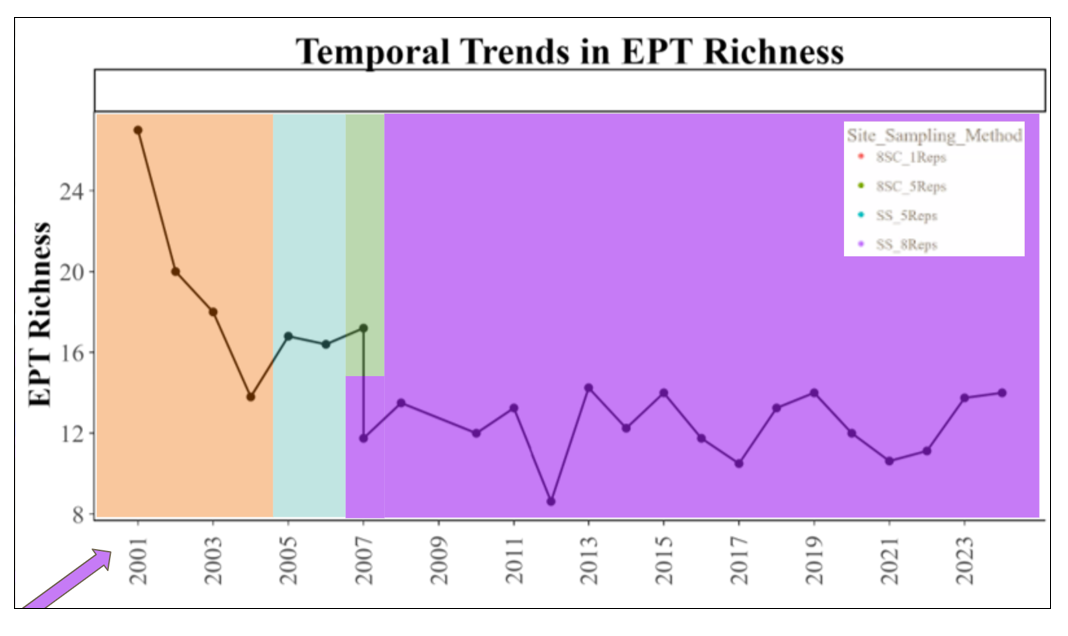
Then participants were shown a graph showing the EPT (Ephemeroptera, Plecoptera, Trichoptera) macroinvertebrate richness over time (2001- present) for Sublette County.
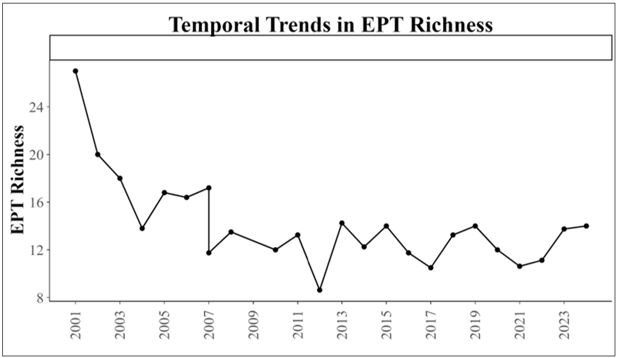
Participants were given 30-45 seconds to explore the graph independently and think about the following prompts:
-
- "What are you noticing?"
- "What are you wondering?"
- "How does your own experience relate to this data?"
After initial observations, another layer of complexity was introduced: sampling methods changed over time. The graph was overlaid with colored bands indicating when different sampling approaches were used. Earlier methods (salmon-colored region) were more coarse, meaning macroinvertebrate samples were combined into a single composite for identification. After 2004, samples were kept separate, which, Sam explained, likely provides a more accurate indication of true richness at a given point in time.
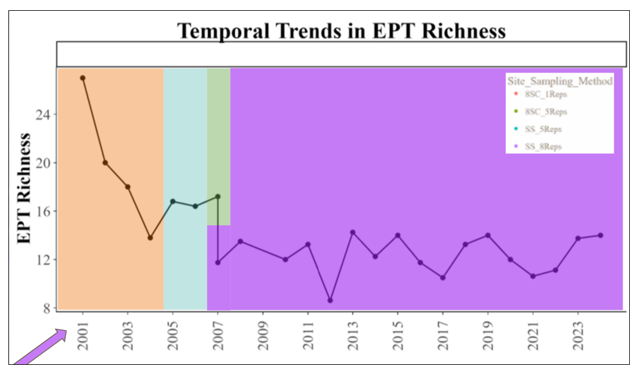
Based on this hypothesis about the separate samples, participants were then asked the following prompts:
-
- "If the composite method had been used in those first four years, how might the trend look differently?"
- "Do you think it would look the same? Do you think those first four years would be higher in richness? Might be lower in richness?"
Participants shared their ideas with the group by stating one of the following:
-
- Higher
- Lower
- They will stay the same
Volunteers who said the trend would be lower were invited to share why they thought this with the group.
Finally, participants returned to their small groups to consider the following prompt:
-
- "Are these data meaningless because sampling techniques changed? Why or why not?"
Once back together in the large group, Sam and Adrienne shared their thoughts on how they make sense of the data and whether they find the data valuable despite changes in sampling methods:
-
- Sam emphasized that long-term macroinvertebrate datasets are rare and valuable, even when sampling methods change over time. She explained that overlapping protocols, transparent corrections, and testing multiple analytical approaches allow them to assess patterns and magnitude shifts.
- Adrienne added the importance of clearly documenting how data are collected to enable better comparisons across data collection methods.
- A participant noted that hearing Sam and Adrienne discuss macroinvertebrate data from a dry stream “underscores the point that the data collection is not meaningless. It just may be helpful in different ways. Even when we think we can’t get data, we continue to get information (i.e. the macros live for a time without water.)”
A Data Check-in Skeleton: These are the general steps we include in all of our data check-ins.
- Consider a shared context and/or puzzling idea.
- Analyze/interpret a related dataset to explore trends, gather evidence, and test initial ideas.
- Reflect on what can be uncovered in these data, what new questions arise, and where you connect to ideas of uncertainty.
- Come together to share takeaways and connections to learners' own interests and contexts.
Reflect on How You Might Connect to these Ideas:
- How could you incorporate similar data exploration activities in your own context?
- What tools or ideas could help learners engage with real-world data?
- How might current research or researchers and interactive datasets enrich your teaching strategies?
Related Educational Resources
Funding provided by Grant: NSF OIA 2149105