

Data Check-in: Puzzle Pieces Connecting Students and Research
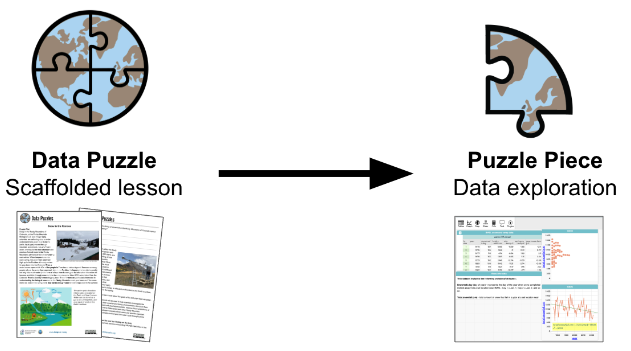
We designed this check-in to use parts of the Puzzle Pieces Collection within Data Puzzles, produced by the Cooperative Institute for Research in Environmental Sciences (CIRES) Center for Education, Engagement and Evaluation (CEEE) team. These CEEE resources are designed to make research, data, and researchers more accessible and engaging for students.
Posted on Nov 27, 2024
Data Check-ins: We include a data-inspired check-in to start each of our TRKE virtual sessions. We aim for these check-ins to be useful for our cohort's shared learning, but also hope our framing and the resources we share might be useful to other folks. We encourage you to look through this data-inspired check-in, explore the resources we use, engage with our prompts, and consider whether you'd be able to adapt this progression for your own context. Check out an example, below, to see if it might be for you, and explore our other posts with the “data check-in” tag to see other examples we’ve used.
Facilitator Context: We designed this check-in to use parts of the Puzzle Pieces Collection within Data Puzzles, produced by the Cooperative Institute for Research in Environmental Sciences (CIRES) Center for Education, Engagement and Evaluation (CEEE) team. These CEEE resources are designed to make research, data, and researchers more accessible and engaging for students.
During our November 14th, 2024 Virtual Session we demonstrated a Puzzle Piece Check-in using the Rocky Mountain Snowfall Puzzle Piece. We used the following framing to engage teachers in the resource.
Framing & Flow: Our participants first viewed a video about billy barr, included in the Puzzle Piece. They were asked to "notice what sorts of patterns or evidence are being presented, or what sorts of stories are being told" in the video.
After showing the video, we posed the following framing: "billy has been tracking snowfall at Rocky Mountain Biological Laboratory in Gothic, Colorado for 40 years. His notebook reveals a clear trend—snowfall is decreasing. But what could be causing this trend?"
"Let's dive into billy’s data to uncover possible explanations for the decrease in snowfall. Use these data shared on the CODAP platform to individually explore:
-
- Potential Connections: What could explain this snow decrease?
- Limitations/Uncertainties: What limitations and/or uncertainties exist based on your connections? What claim(s) can you make and with what level of certainty?
Come back at the end of our data exploration time ready to share your thoughts about potential connections and limitations/uncertainties."
When they returned from navigating billy's data on the CODAP platform, the participants responded to the following questions:
-
- "What did you figure out?"
- "What more do you now wonder?"
A Data Check-in Skeleton: These are the general steps we include in all of our data check-ins.
- Consider a shared context and/or puzzling idea.
- Analyze/interpret a related dataset to explore trends, gather evidence, and test initial ideas.
- Reflect on what can be uncovered in these data, what new questions arise, and where you connect to ideas of uncertainty.
- Come together to share takeaways and connections to learners' own interests and contexts.
Reflect on How You Might Connect to these Ideas:
- How could you incorporate similar data exploration activities in your own context?
- What tools or ideas could help learners engage with real-world data?
- How might current research or researchers and interactive datasets enrich your teaching strategies?
Funding provided by Grant: NSF OIA 2149105